Valuation · EV/EBITDA model
Is Tyler Technologies (TYL) stock overvalued?
On November 1, 2026, with the shares at $394.30, a quick EV/EBITDA model by Brief Equity valued Tyler Technologies at about $431 for 2028. Tyler looks overvalued on that model unless its revenue growth rises well above the 9.7% a year that analyst consensus expects through 2028: with the rest of the model held constant, the share price implies revenue growth of about 13.5% a year.
By The Brief Equity Team · Model dated · Published
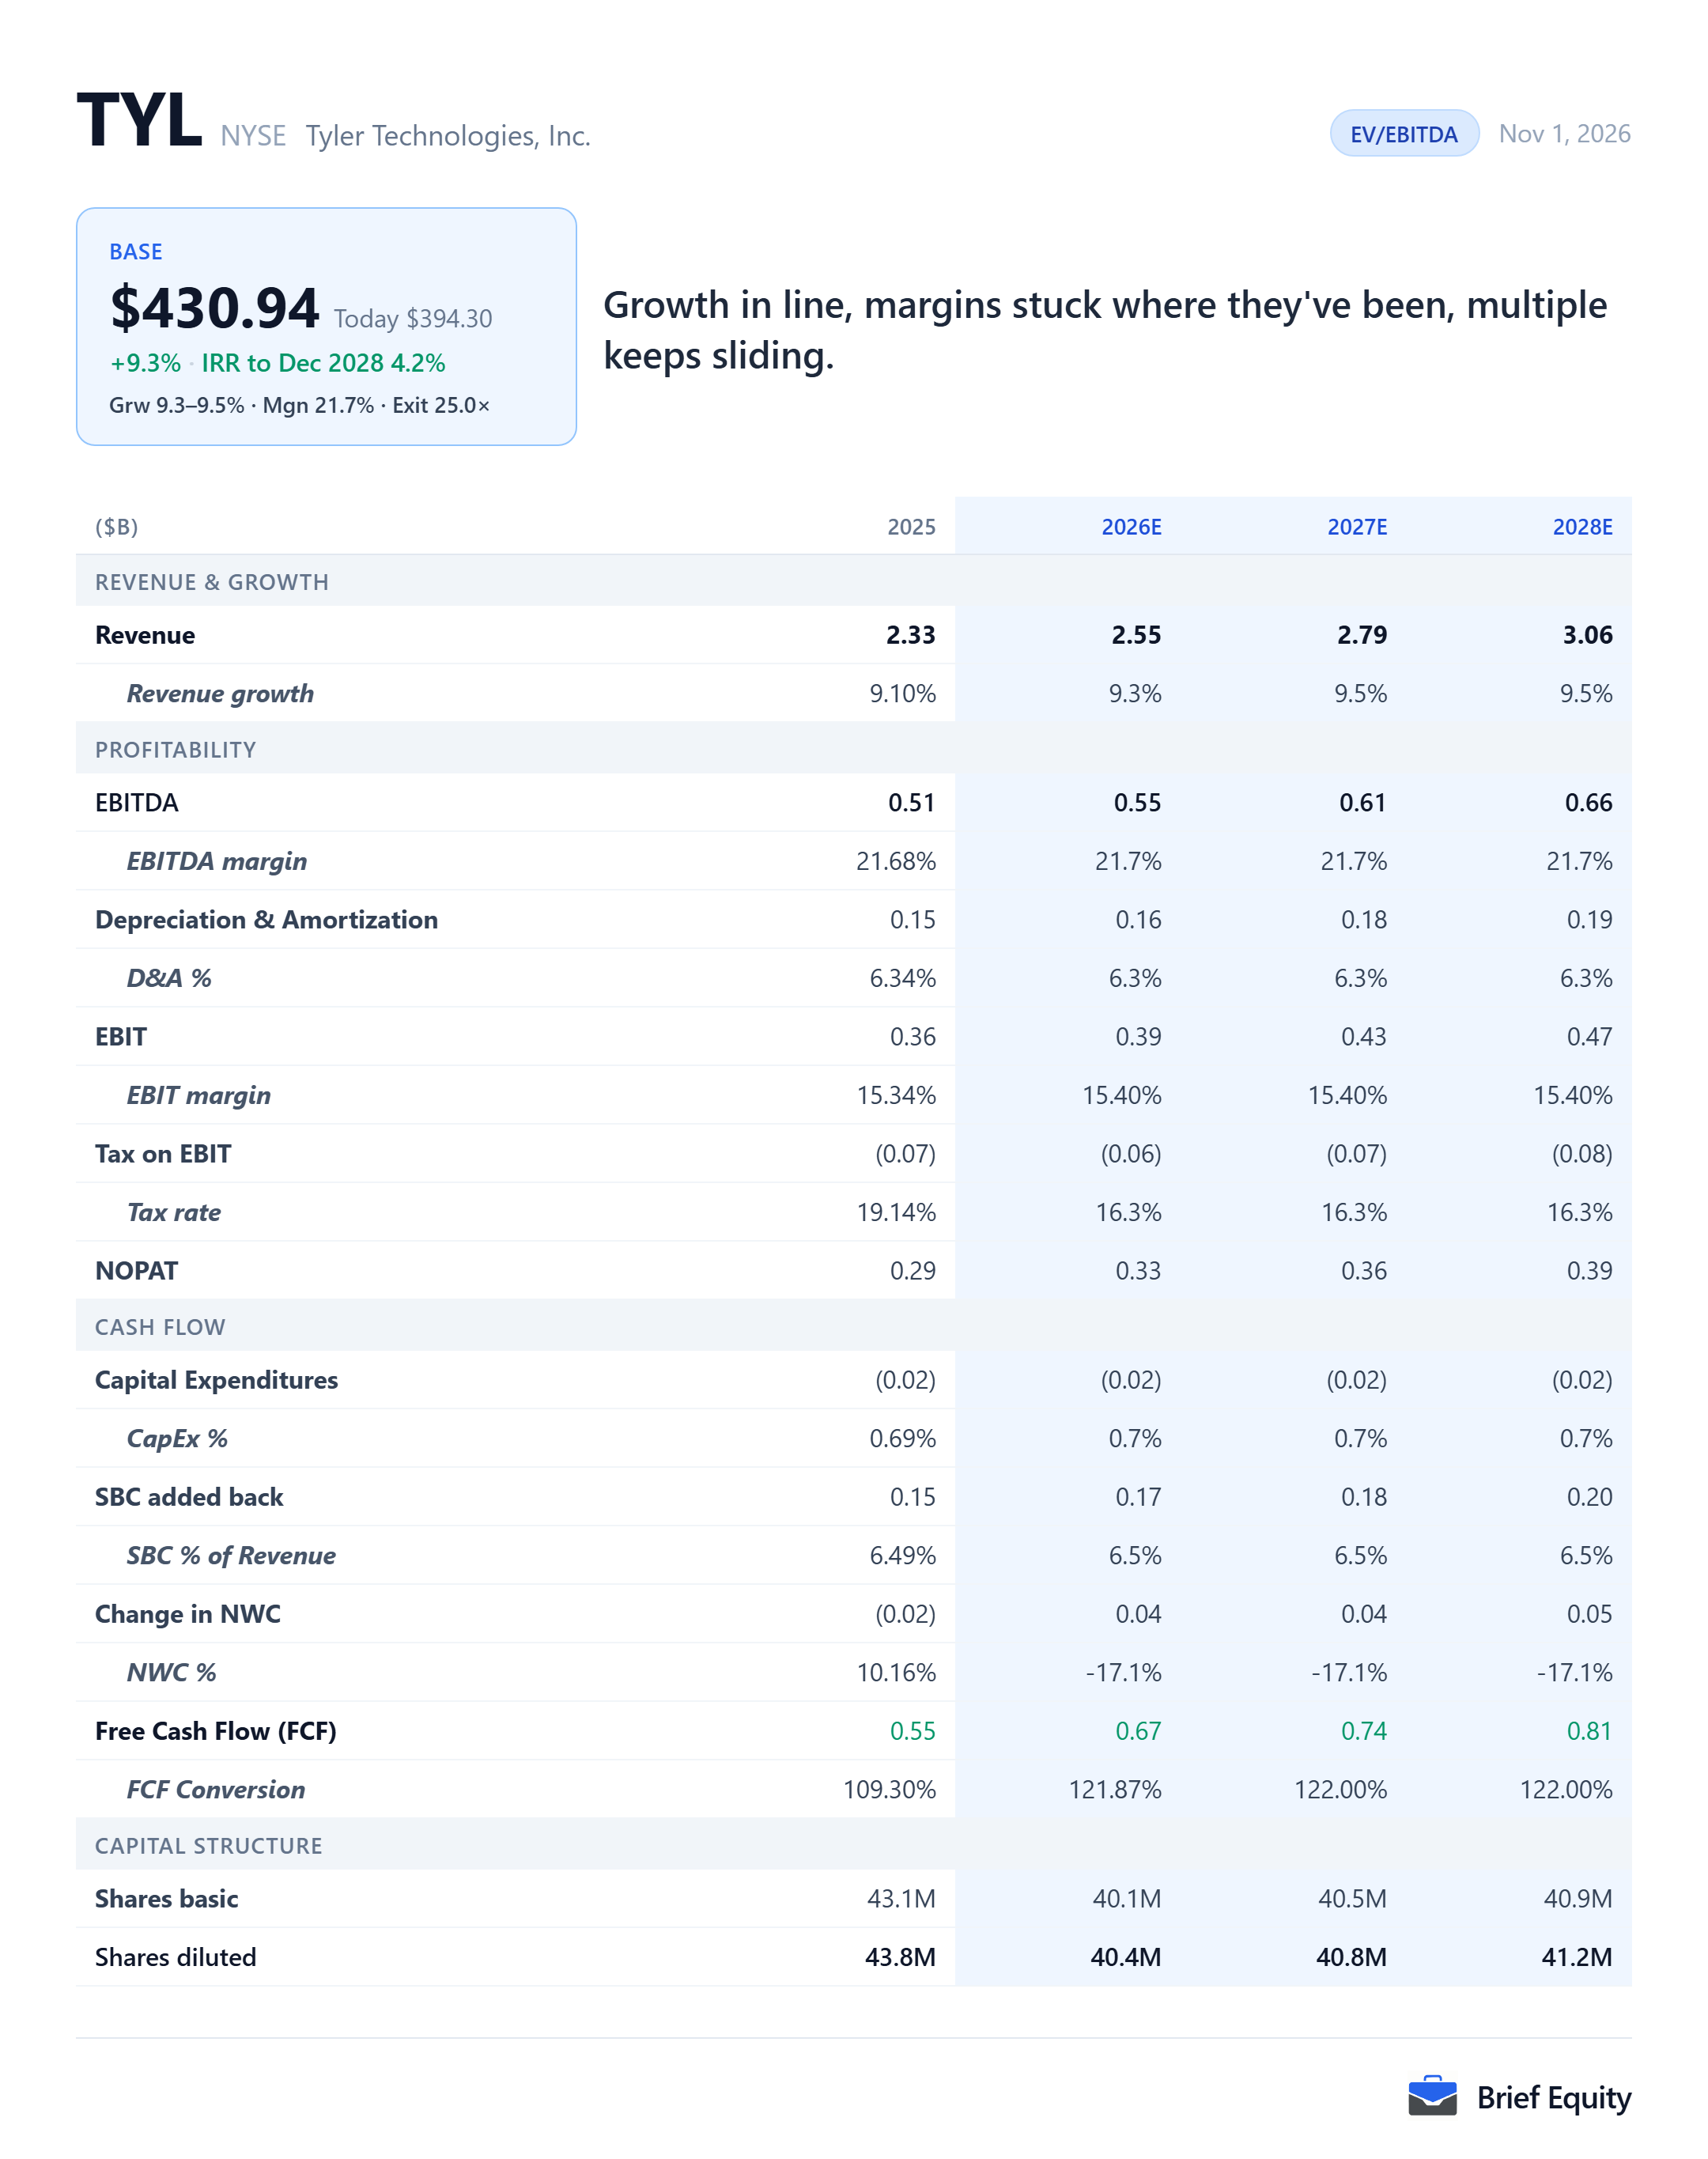
The model's assumptions for Tyler Technologies
Tyler Technologies' fiscal year is the calendar year, and the last year it has reported is 2025. The model runs three years, to 2028. Every row below is the model's own except the analyst consensus revenue.
| 2026 | 2027 | 2028 | |
|---|---|---|---|
| Revenue, model | 2.55 | 2.79 | 3.06 |
| Revenue growth, model | 9.3% | 9.5% | 9.5% |
| EBITDA, model | 0.55 | 0.61 | 0.66 |
| EBITDA margin, model | 21.7% | 21.7% | 21.7% |
| Revenue, analyst consensus | 2.55 | 2.80 | 3.08 |
Why Tyler Technologies looks overvalued
Tyler Technologies' shares closed at $394.30 on October 30, 2026, against $387.44 on November 2, 2020, while its revenue grew from $1.12 billion in 2020 to $2.33 billion in 2025.
Much of Tyler's growth over that period was acquired: it bought NIC, a digital government and payments company, in April 2021 for approximately $2.0 billion net of cash. SaaS fees were 33.3% of Tyler's 2025 revenue, and SaaS revenue grew 21.2% in the third quarter of 2026. On the earnings call of October 29, 2026, an analyst put organic SaaS growth at 16%, and Tyler's chief financial officer said growth is below the company's target.
“In terms of the SaaS growth rate, we remain very confident in that long-term 20% through 2030 that we've set as a target.”
Brian Miller, Chief Financial Officer, Tyler Technologies third-quarter 2026 earnings call, October 29, 2026
The model has Tyler's revenue growing inside the company's guidance for 2026 and at 9.5% in 2027 and 2028, just under analyst consensus of 9.7% a year from 2025 to 2028. With the EBITDA margin held at 21.7% and an exit multiple of 25 times EBITDA, the model values Tyler at about $431 a share for 2028, about 9% above the share price.
With the rest of the model held constant, Tyler's share price implies revenue growth of about 13.5% a year, against the 9.1% Tyler reported for 2025.
Tyler's operating margin was 15.5% of revenue in 2020 and 15.3% in 2025.
What has to be true, and what would break it
Tyler Technologies looks overvalued on this model as long as its growth stays near what the company guides and analysts expect.
What has to be true
- Tyler's revenue growth stays close to the 9.7% a year that analyst consensus expects from 2025 to 2028.
- Organic SaaS growth stays below the company's target of 20% a year through 2030.
- Tyler's operating margin stays close to the 15.5% of 2020 and the 15.3% of 2025.
What would break it
- Tyler's revenue growth reaches the roughly 13.5% a year that the share price implies.
- The market pays more than 25 times Tyler's EBITDA at the end of 2028.
The parts of Tyler Technologies's business
Tyler Technologies reports its revenue by type, and SaaS fees and transaction-based fees were its two largest lines in 2025. Maintenance, professional services and software licenses fell in 2025, so their shares of the year's growth are negative.
| Share of revenue | Share of revenue growth | |
|---|---|---|
| Transaction-based fees | 34.7% | 56.7% |
| SaaS fees | 33.3% | 68.4% |
| Maintenance | 19.1% | |
| Professional services | 10.4% | |
| Hardware and other | 1.9% | 1.9% |
| Software licenses and royalties | 0.5% |
Tyler Technologies beside its peers
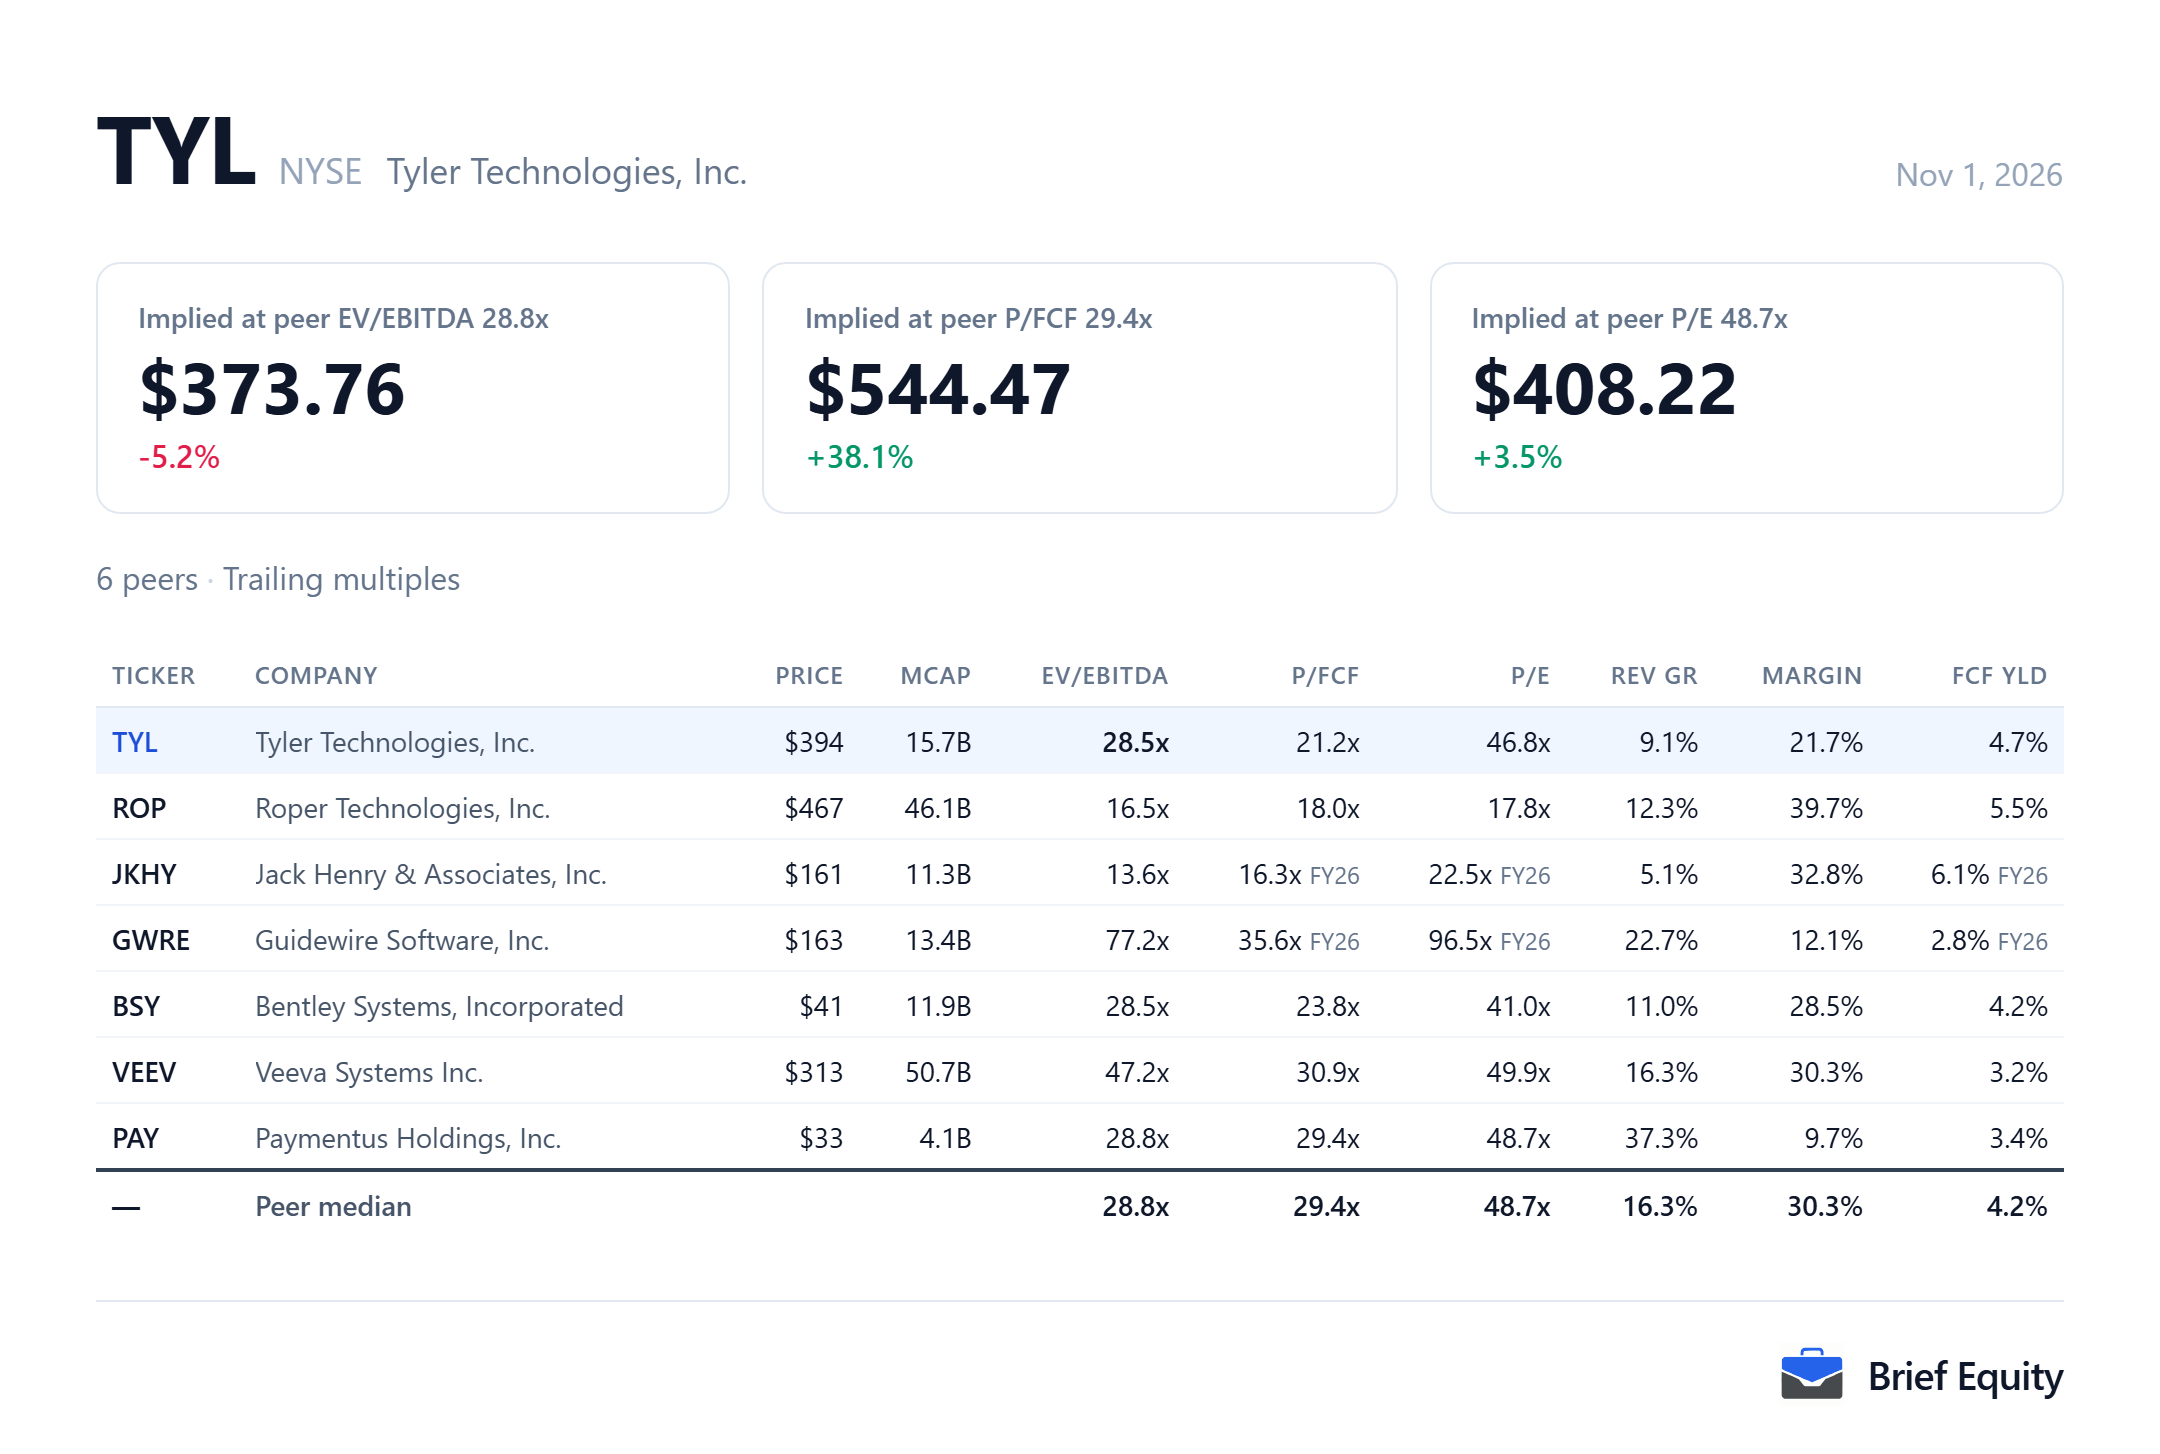
Tyler Technologies is compared here with six US-listed companies, chosen to cover its government software, its move of clients to the cloud and its payments business.
- ROP: Vertical software, including government
- JKHY: Core systems sold on recurring contracts
- GWRE: The same move of clients from on-premises software to the cloud
- BSY: Software for public infrastructure
- VEEV: Vertical SaaS
- PAY: Bill payments, beside the transaction-based fees
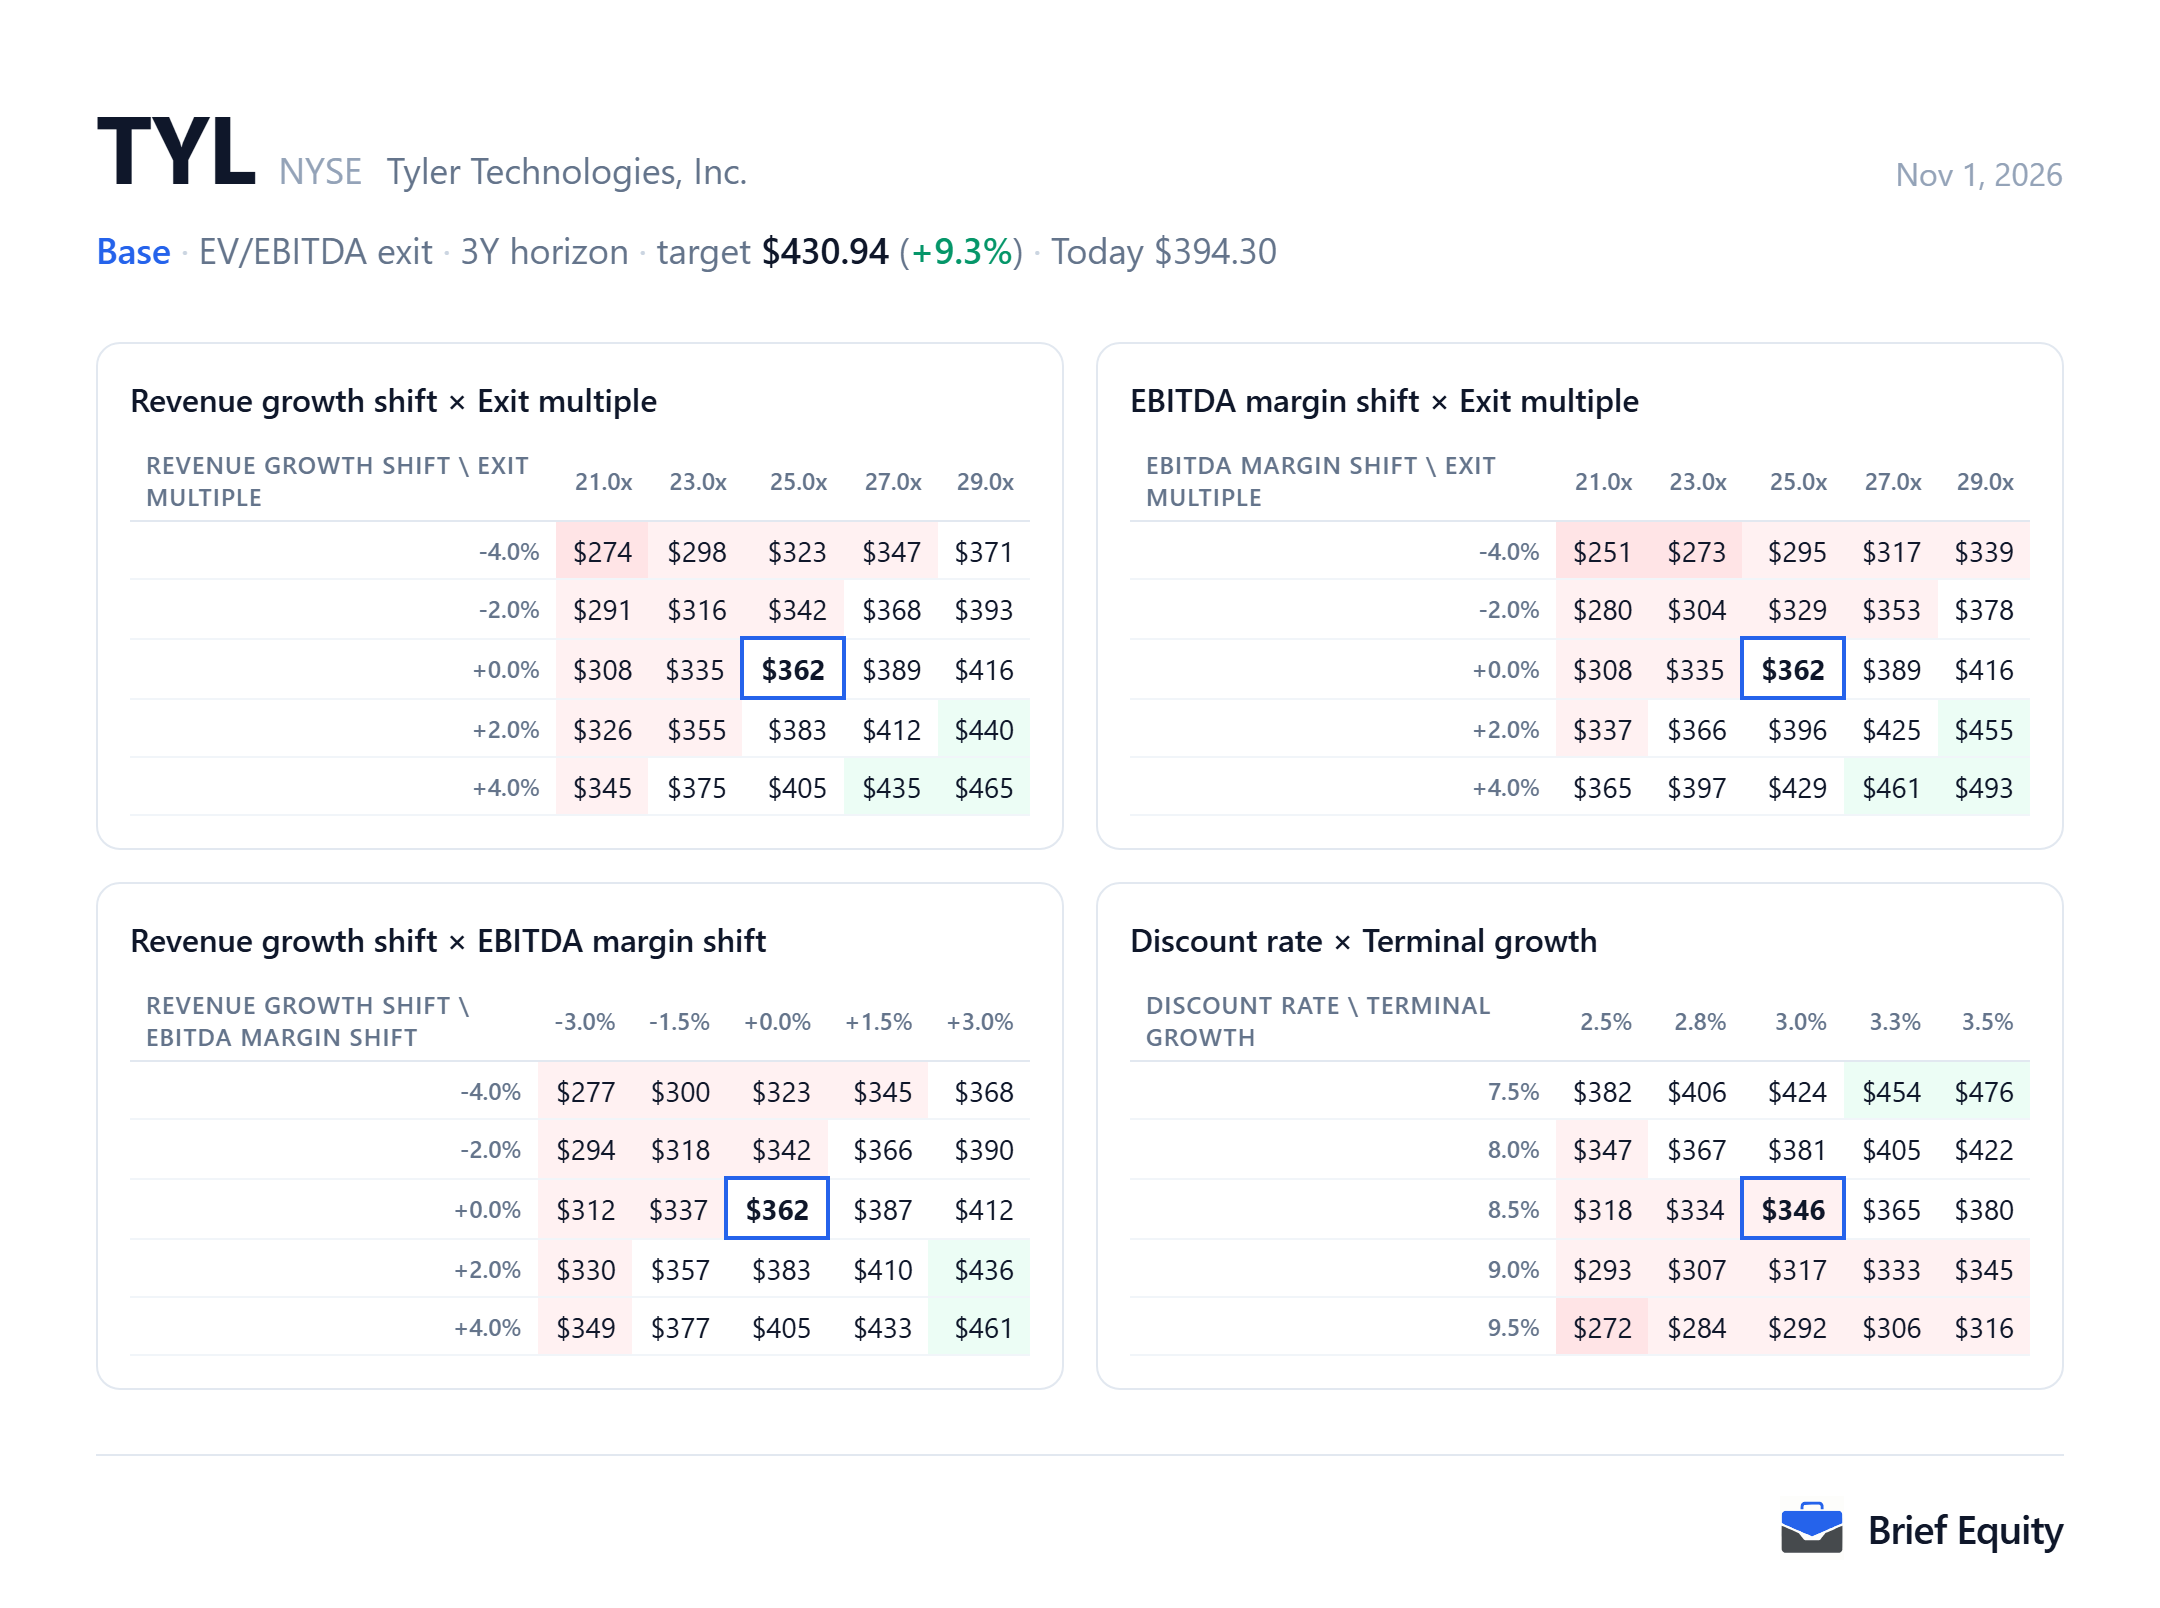
How the estimate moves with its assumptions
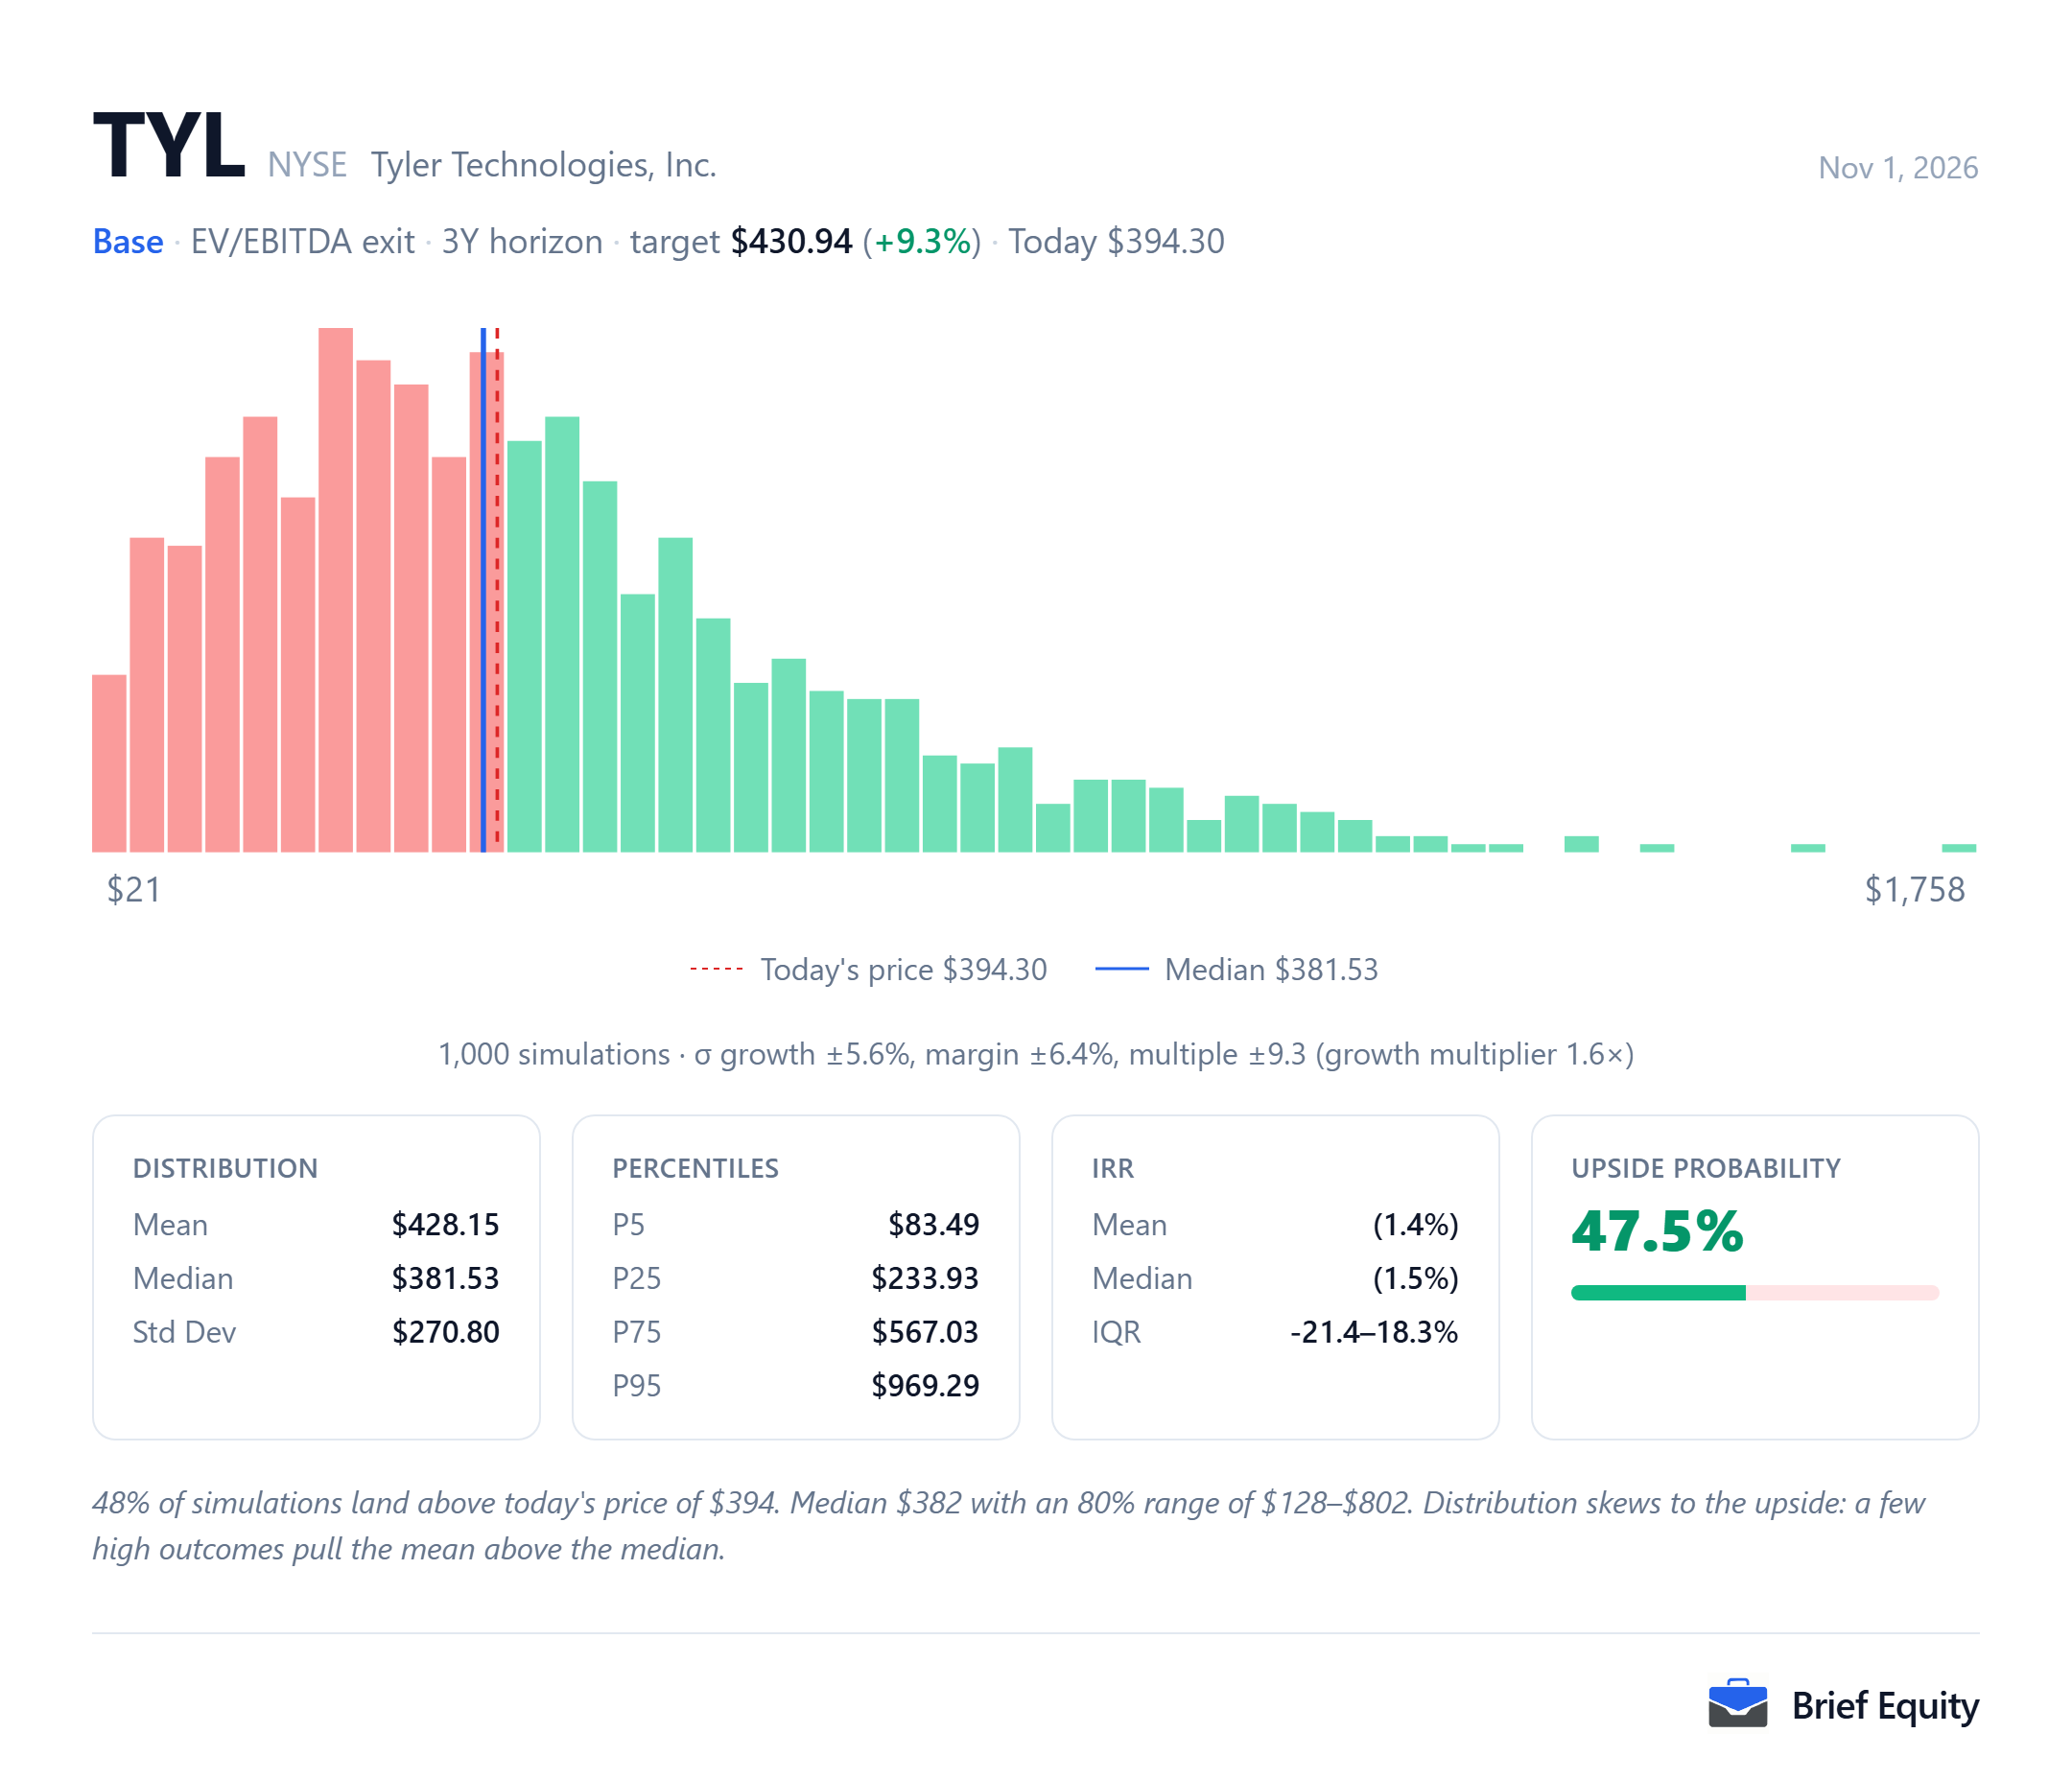
The two Tyler Technologies cards below test the estimate: the sensitivity grids move two assumptions at a time, and the Monte Carlo card reruns the model many times with growth, margin and the exit multiple drawn at random.
Questions about Tyler Technologies
These questions about Tyler Technologies (TYL) are answered from the documents listed under Sources.
- What revenue does Tyler Technologies expect for 2026?
- As of October 28, 2026, Tyler Technologies guided full-year 2026 total revenues of $2.535 billion to $2.565 billion and non-GAAP diluted earnings per share of $12.95 to $13.20.
- How many shares has Tyler Technologies bought back in 2026?
- In the third quarter of 2026 Tyler Technologies repurchased 1,148,389 shares for approximately $379 million, and its release of October 28, 2026 put the year-to-date total at approximately 8.5% of its outstanding shares.
- When did Tyler Technologies acquire NIC?
- Tyler Technologies acquired NIC, a digital government solutions and payment company, on April 21, 2021, for approximately $2.0 billion net of cash acquired.
- How much of Tyler Technologies' revenue is federal?
- On its earnings call of October 29, 2026, Tyler Technologies said federal is still a market that is less than 5% of its total revenues.
Sources
The quotations and facts about Tyler Technologies (TYL) on this page rest on the documents below.
- Tyler Technologies third-quarter 2026 results release, October 28, 2026
- Tyler Technologies third-quarter 2026 earnings call, October 29, 2026
- Tyler Technologies annual report on Form 10-K for 2025, February 18, 2026
- Tyler Technologies annual report on Form 10-K for 2022, February 22, 2023
- Daily closing share prices for Tyler Technologies, October 30, 2026
About this page
Brief Equity and its team hold no position in Tyler Technologies (TYL) as of November 1, 2026.
This page is research, not investment advice. It describes one model and the assumptions behind it, and market data is delayed. Read how these models are built and our editorial policy.
Related guides: How to value a stock yourself (without Excel), How to write an investment thesis.