Knowledge graph
See how it all connects
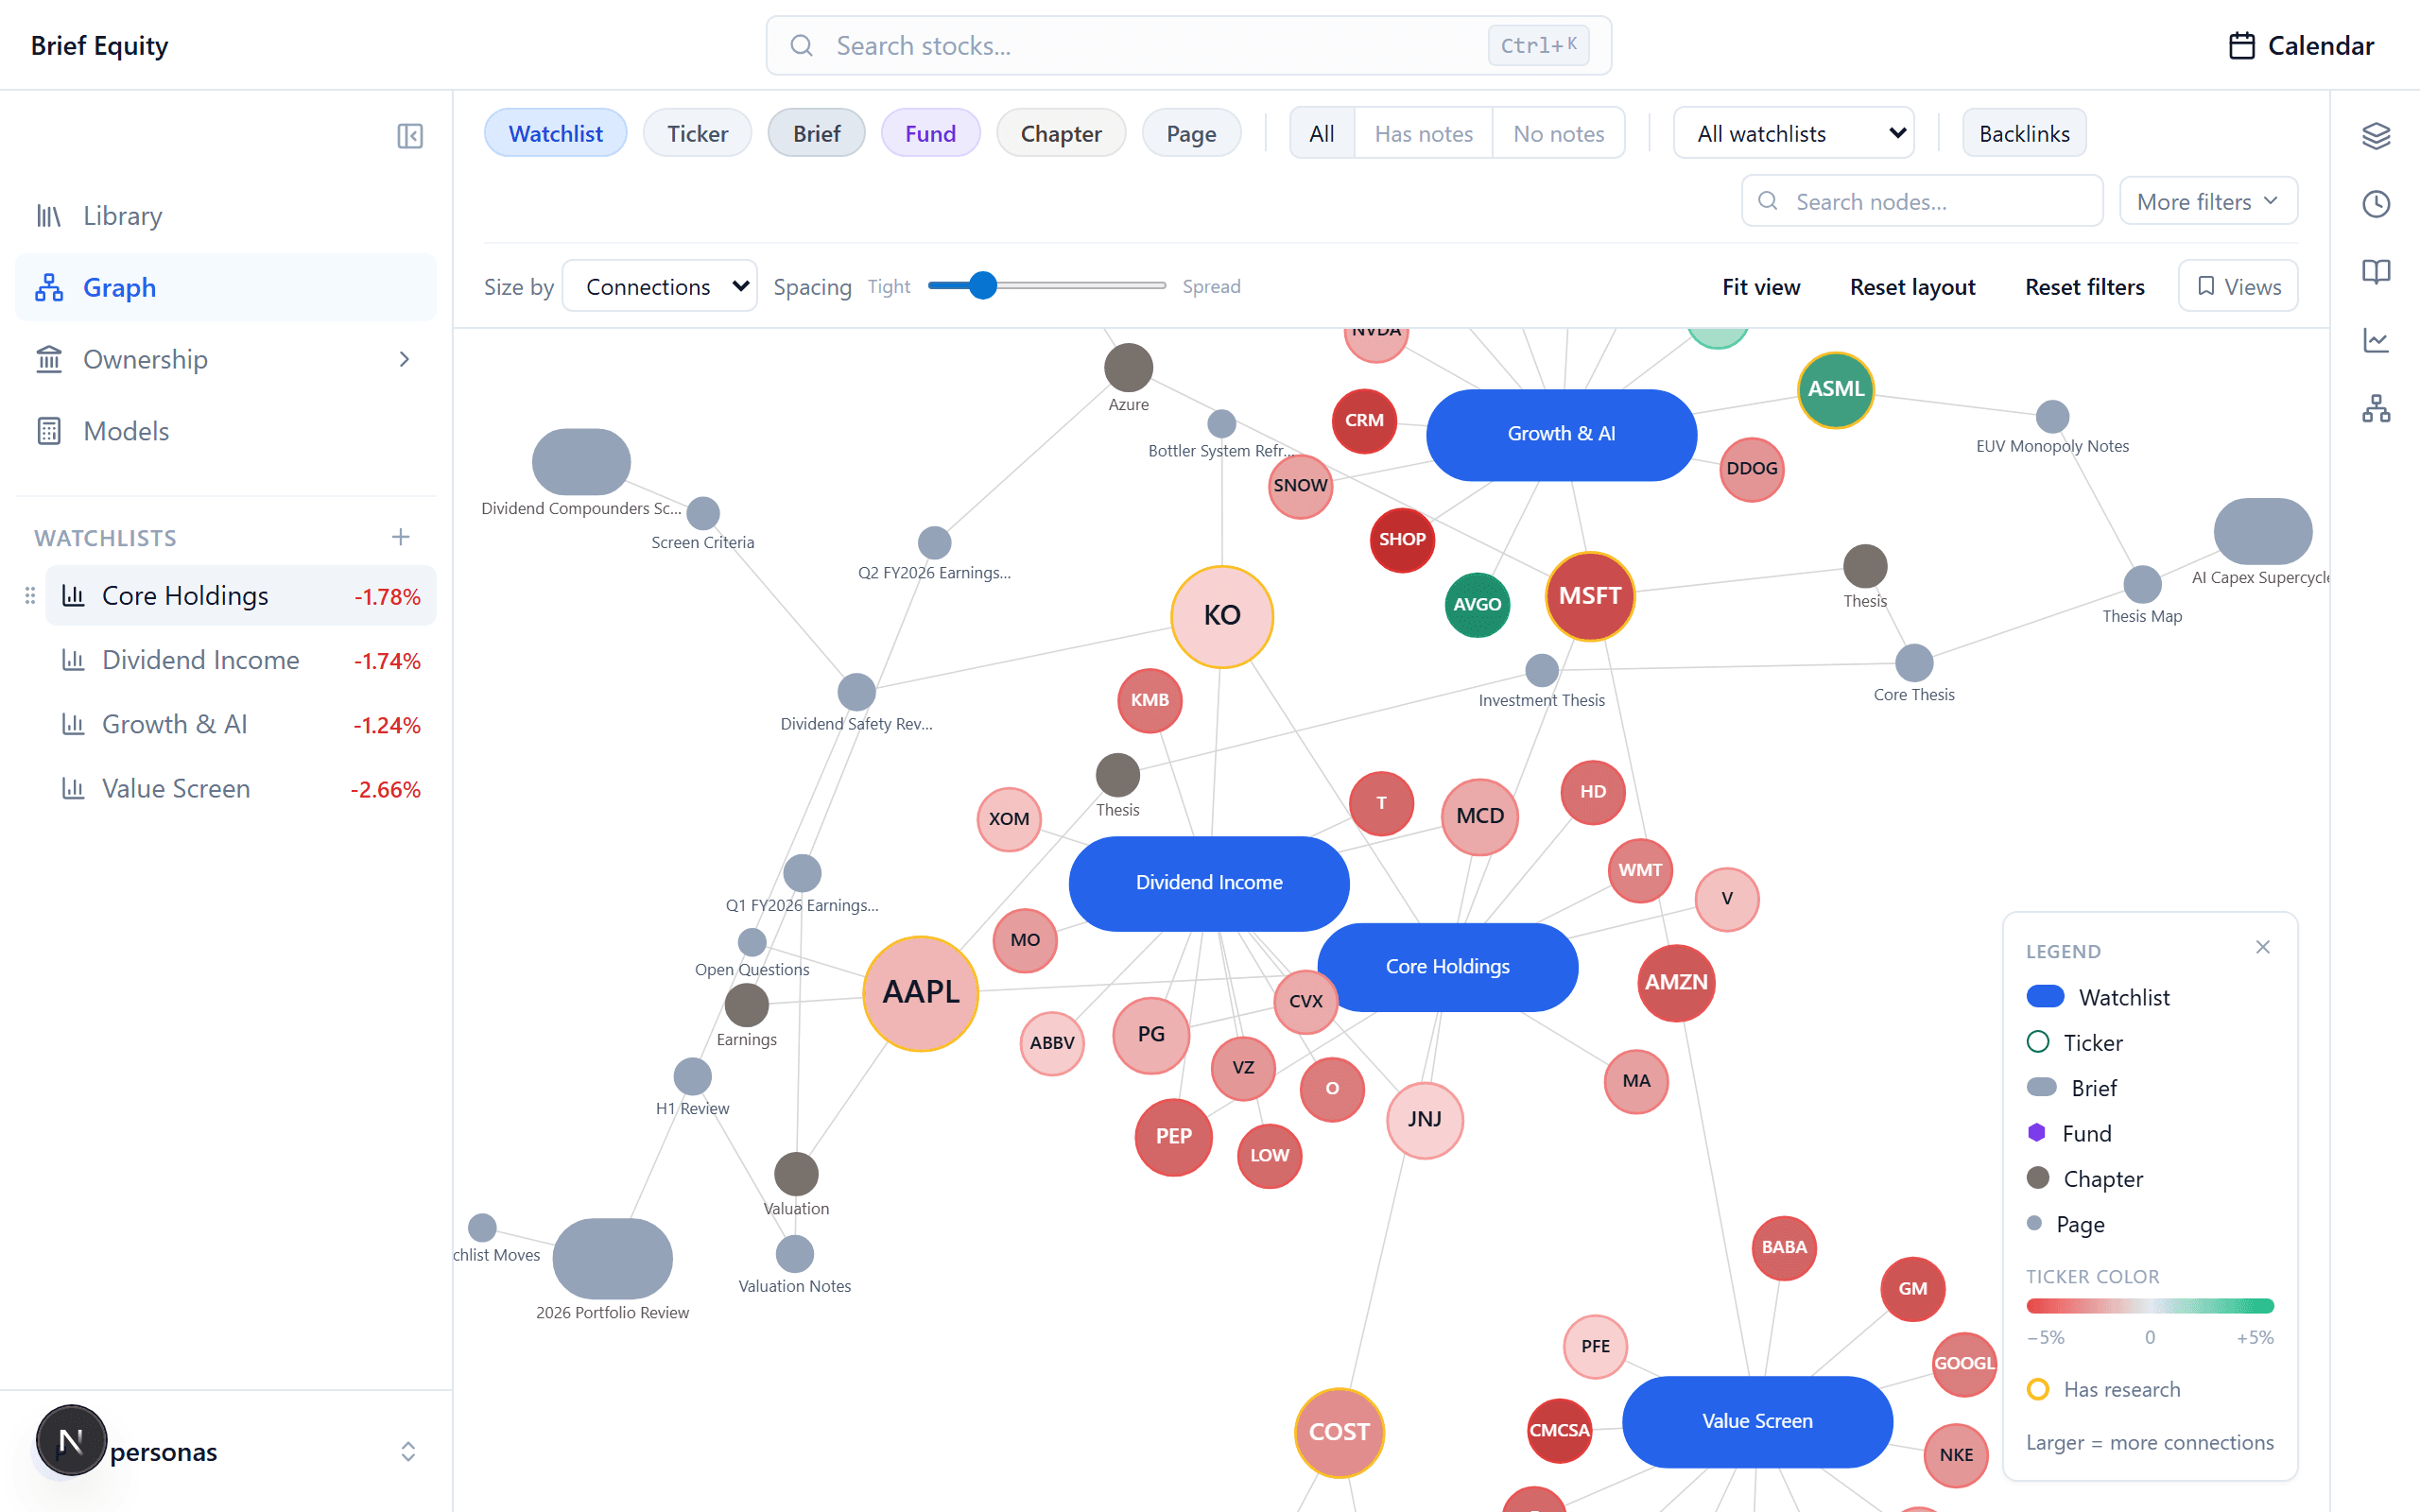
The Brief Equity knowledge graph renders your watchlists, tickers, briefs, notes, and the funds you follow as one force-directed graph, so you can see how every part of your research connects.
Watch the walkthrough
Everything as one graph
Your watchlists, tickers, briefs, chapters, pages, and the funds you follow are rendered as connected nodes in a single force-directed view. Color marks the node type, and size can track connections, page count, market cap, or volume.
Filter and focus
Toggle node types on and off, scope to a single watchlist, show only tickers that have research, or filter by performance. Focus a fund to see where its holdings overlap yours, then open a preview panel to inspect any node without leaving the graph.
The links between your notes
Turn on Backlinks to see every place one note page links to or embeds another, the web of mentions across your research. If you have used Obsidian, the idea will feel familiar, except here it reaches past your notes to your tickers, watchlists, and funds.
Frequently asked questions
- What does the knowledge graph show?
- Your watchlists, tickers, briefs, notes, and the funds you follow as one force-directed graph of connected nodes.
- Does it show the links between my notes?
- Yes. Turn on Backlinks to see every place one note links to or embeds another, the same web-of-mentions idea as Obsidian, extended to your tickers, watchlists, and funds.
- Is the graph just a visualization?
- It is also a way to navigate your research. Filter by type or watchlist, then open preview panels to inspect any node.
One workspace
How it connects
Brief Equity isn't a stack of separate tools. This surface flows straight into the rest of the workspace.
Workspace
Write your thesis next to the data
A notebook for every stock. Capture passages and financials from the source into linked notes, organized as a library, briefs, and a board.
ExploreOwnership
Follow the institutional money
Search any fund or company's 13F filings, X-ray how a manager invests, and see ownership auto-filtered to the tickers on your watchlists.
ExploreWatchlists
Track every position in one place
Individual stocks across unlimited lists, each with the columns you choose, plus an events calendar and a full stock page behind every ticker.
Explore