Google Finance alternative
Want something better than Google Finance? Here it is.
Brief Equity turns a watchlist into research you keep: one feed, a true notebook for every stock, your own DCF and EV/EBITDA models, 13F ownership, and a graph that connects it all.

What you gain
What changes when your research moves from Google Finance to Brief Equity.
A true notebook for every stock
A full editor, not an afterthought: headings, tables, checklists, and callouts, in chapters and pages. Save a passage from an earnings call or a block of financials into it, with a link back to the source.

DCF and EV/EBITDA models
Value a company on your own assumptions: a discounted cash flow and an EV/EBITDA model with Bear, Base, and Bull scenarios, a sensitivity table, and a Monte Carlo range.

13F ownership, fund by fund
Quarterly 13F filings show who holds a stock and what each fund bought or sold. Open a fund for its whole portfolio, or see ownership across your watchlists.

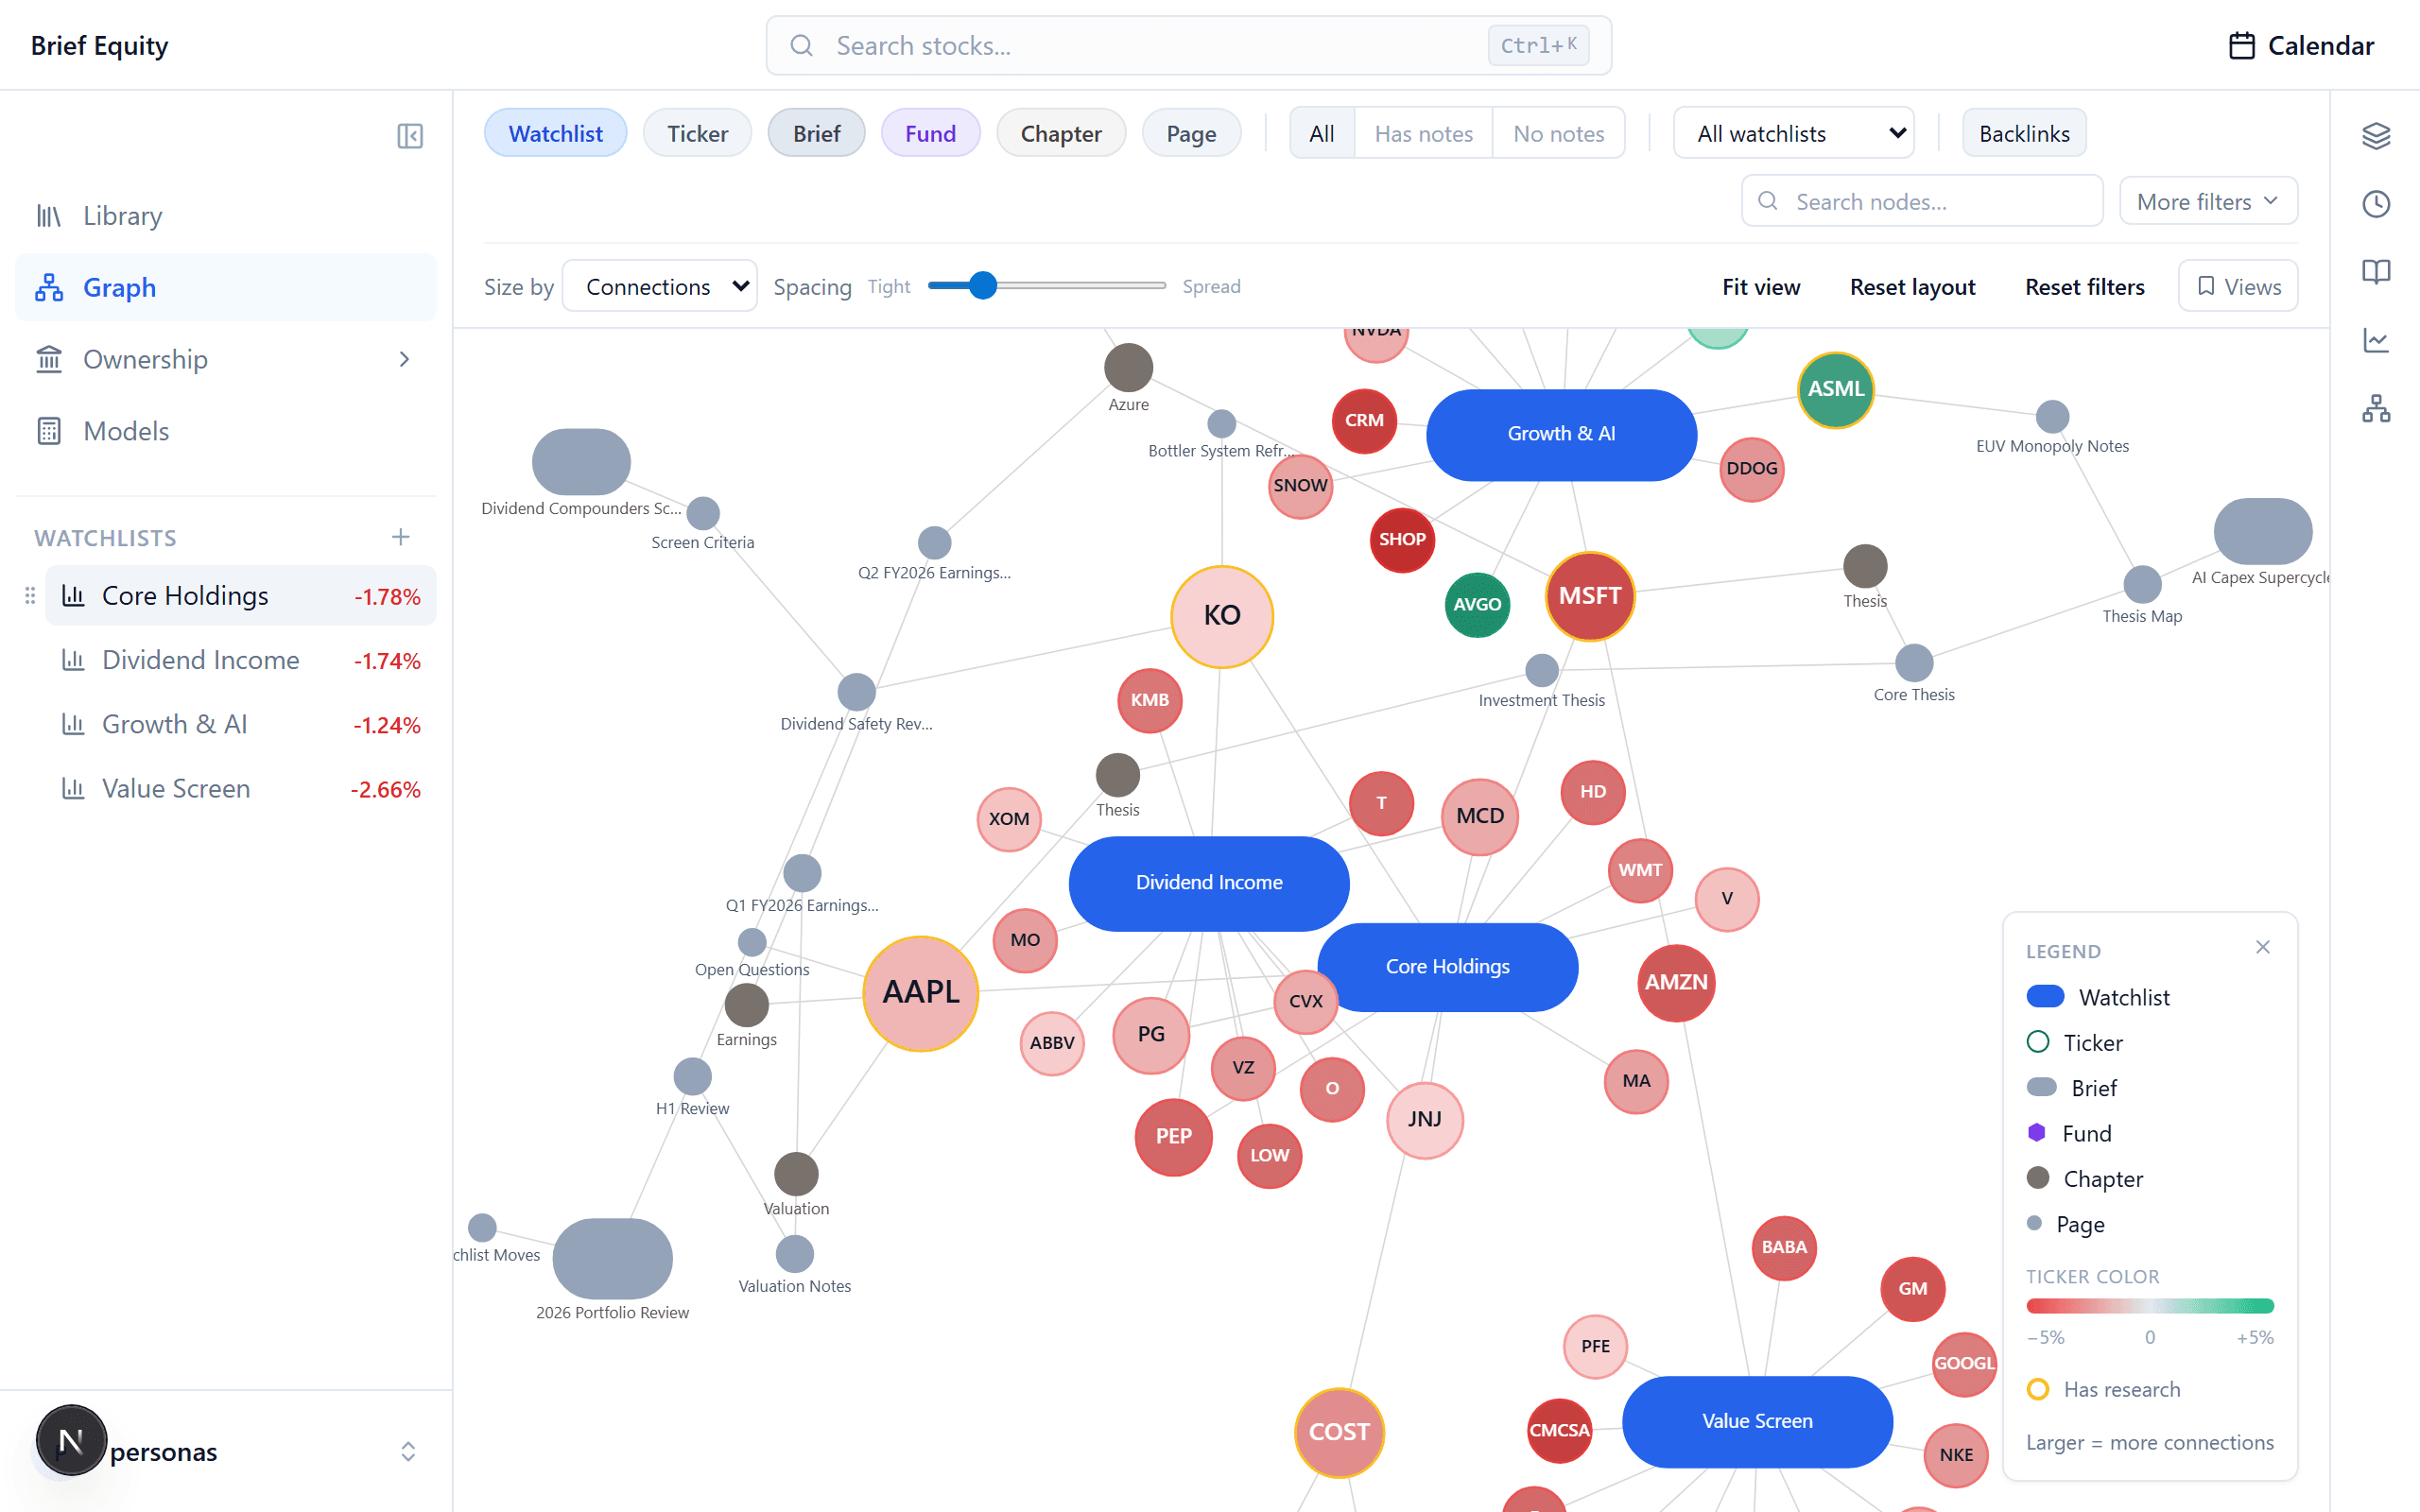
A graph of your research
Your watchlists, stocks, notes, and the funds you follow, drawn as one connected map that grows as you work.
What you keep
You keep all of this when you move from Google Finance.
- US and international stocks on 60+ exchanges
- 20 years of annual statements and 40 quarters
- Earnings-call transcripts, SEC filings, and news from 16 outlets
- Watchlists with 182 metrics to add as columns
- Insider trades and analyst ratings
Bottom line
Brief Equity is where watching a stock becomes research: your notes, your models, the funds behind it, and one feed, in one workspace.
Brief Equity vs Google Finance at a glance
| Feature | Brief Equity | Google Finance |
|---|---|---|
| Notes | A research library with your own columns and a notebook for every stock | None among its listed features |
| Valuation models | DCF and EV/EBITDA with Bear, Base, and Bull scenarios, sensitivity, and Monte Carlo | No model builder listed |
| 13F ownership | Who holds a stock and what each fund did last quarter, filtered to your watchlists | Insiders and Politicians views on a stock's Holdings tab; no 13F data listed |
| Research graph | A knowledge graph of your watchlists, stocks, notes, and funds | None among its listed features |
| Research feed | One feed across every watchlist: news, transcripts, SEC filings, insider trades, and analyst ratings | News for a watchlist; transcripts and filings on each stock's Earnings tab |
| Market overview | An overview dashboard, news, filing, insider, and analyst streams, and the market-wide earnings week, wired to the tickers you track | Index, currency, crypto, and futures tabs, a market summary, movers, and an earnings calendar |
| Plans | One plan, everything included, after a 10-day free trial with no card | Free; a Google Account unlocks custom lists and full AI research |
Bring your watchlist
Copy the tickers from your Google Finance watchlist and paste them into a new Brief Equity watchlist, up to 50 at a time, separated by commas, spaces or new lines. You check the matches, then add them all at once.
Frequently asked questions
- Is Brief Equity a good Google Finance alternative?
- Yes. Brief Equity covers US and international stocks on 60+ exchanges and adds a workspace that Google Finance's own pages do not list: a research library with a notebook for every stock, passages and numbers saved from the source, DCF and EV/EBITDA models on your own assumptions, 13F ownership, and a knowledge graph.
- What does Brief Equity do that Google Finance does not?
- The research itself: a research library with your own columns and a notebook for every stock, passages and figures saved from the source with a back-link, DCF and EV/EBITDA models with Bear, Base, and Bull scenarios and a Monte Carlo range, 13F ownership with fund pages filtered to the tickers you track, and a knowledge graph. Google Finance's help article lists no notes, valuation model builder, 13F data, or graph (as of October 2026).
- Does Google Finance have earnings transcripts?
- Yes. Each stock's Earnings tab on Google Finance has call audio with replays, transcripts with highlights, and AI summaries (as of October 2026). Brief Equity puts transcripts in the feed for every ticker on your watchlists and opens them in a reader that groups the Q&A question by question. Select a passage and it saves into your notes with a back-link to the exact spot.
- Does Brief Equity cover international stocks?
- Yes. Brief Equity covers US and international stocks on 60+ exchanges: prices, charts, financial statements, dividends, watchlists, notes, and your own valuation models work on every one of them. Filings, insider trades, and 13F ownership come from SEC records.
- How much does Brief Equity cost next to Google Finance?
- Brief Equity is one plan with everything included: a 10-day free trial with no card, then $38/mo billed annually ($48/mo monthly). Google Finance is free, and signing in with a Google Account adds custom lists and its full AI research features (as of October 2026).
- Can I move my Google Finance watchlist to Brief Equity?
- Yes. Copy the tickers and paste them into a new watchlist, up to 50 at a time, separated by commas, spaces, or new lines. You check the matches, then add them all at once.
Read the full comparison
From tracking the market to a research workspace
Google Finance is Google's free site for quotes, charts, and market news. Its help article describes news tailored to your watchlist, charting tools, an AI research panel, an Earnings tab with call audio and transcripts, portfolios, and scheduled market updates (as of October 2026). Brief Equity is the workspace for what comes after the quote. You track stocks on watchlists, read one feed for all of them, write your thesis in a notebook for each, build your own models, and follow the funds that hold them.
Brief Equity reads the market too: an overview dashboard, the earnings week for the whole market, and news, filing, insider, and analyst streams across every ticker. That view is wired to the tickers you track. The earnings week marks them, and a click opens one in the right rail beside your notes.
Google Finance's home page has tabs for indexes by region, currencies, crypto, and futures, a market summary, the day's most active stocks, gainers, and losers, and an earnings calendar that shows all stocks or the ones in your list (as of October 2026).
The research you keep
Brief Equity's feed carries news, press releases, earnings-call transcripts, SEC filings, insider trades, and analyst ratings for every ticker on your watchlists, with a tab per source. Select a passage in a transcript or press release and it saves into a note as a callout with a back-link to the exact spot. A block of cells from the financials saves as a table, and a chart or a model's valuation card saves as an image.
The notes sit in a research library with your own columns, stages, and tags, and a notebook for every stock. Your columns come in 7 types, any of 182 market metrics can sit beside them, you can filter by any column, and a board lays the stocks out in lanes by a field such as Stage or Conviction. A knowledge graph draws your watchlists, stocks, notes, and the funds you follow as one picture.
Google Finance keeps lists of symbols and portfolios. Its help article lists no notes, research library, or graph (as of October 2026).
Earnings calls and filings
Open a transcript in Brief Equity and it reads as a conversation: each speaker's remarks set apart, the Q&A grouped question by question, and a button that skips straight to it. Select any passage to save it to your notes. A filing, a press release, or an earnings transcript in the feed has a menu that opens ChatGPT or Claude on it, and a transcript can be copied as Markdown or downloaded as a file.
Google Finance puts earnings on each stock's Earnings tab: call audio with replays, transcripts with highlights, AI summaries, and official filings under Documents and forms (as of October 2026). In Brief Equity the same documents arrive in one feed for every ticker you track, so you read across your watchlists without opening each stock.
Valuation models
Brief Equity's models are a discounted cash flow and an EV/EBITDA model, driven by your own assumptions: Bear, Base, and Bull scenarios, sensitivity analysis, a Monte Carlo distribution over the inputs, peer comparables, an exit-multiple value on EV/EBITDA, EV/Sales, or EV/EBIT, and versions you save and restore.
Google Finance has an AI research panel that answers questions and writes research reports on any topic. Its help article lists no valuation model builder (as of October 2026).
13F ownership
Quarterly 13F filings show who holds a stock and what each fund did last quarter. Open a fund for its portfolio, turnover, 1-year relative performance, and concentration, save the funds you follow into one dashboard, and see ownership filtered to the tickers on your watchlists.
On Google Finance, a stock's Holdings tab has two views, Insiders and Politicians. Its stock page and help article list no 13F data (as of October 2026).
Data and coverage
Brief Equity covers US and international stocks on 60+ exchanges. Every stock page has four tabs: Overview, Charts, Financials, and Dividends. Financials hold the income statement, balance sheet, and cash flow, with 20 years of annual statements, 40 quarters, and a trailing-twelve-month column. Charts carry price with volume, moving averages, and Bollinger bands, plus panes for P/E, EV/EBITDA, and other multiples.
Filings, insider trades, and 13F ownership come from SEC records.
Google Finance's stock page has Overview, Analysis, Earnings, Financials, and Holdings tabs. Financials hold the income statement, balance sheet, and cash flow by quarter or by year, and the chart draws as an area, line, candle, or bar with moving-average indicators (as of October 2026).
Plans and pricing
Brief Equity is one plan with everything included: a 10-day free trial with no card, then $38/mo billed annually ($48/mo monthly). The plan covers the work itself: the notebooks, the models, 13F ownership, the graph, and the feed.
Google Finance is free. Signing in with a Google Account adds custom lists and its full AI research features (as of October 2026).
By The Brief Equity Team · Published · Updated
In the product
How Brief Equity does it
Every part of the Brief Equity workspace, each on its own page.
Workspace
Build your research database
A research database you shape: your columns, stages, and tags, a notebook for every stock, and capture from the source with a link back.
ExploreFilterable feed
One feed for everything you track
One filterable stream of news, press releases, transcripts, filings, insider trades, and analyst ratings for every ticker you track.
ExploreModels
Value it yourself
Build a DCF and EV/EBITDA model on your own assumptions, with Bear, Base, and Bull scenarios, sensitivity and Monte-Carlo analysis, and peer comps.
ExploreOwnership
Follow the institutional money
Search any fund or company's 13F filings, X-ray how a manager invests, and see ownership auto-filtered to the tickers on your watchlists.
ExploreKnowledge graph
See how it all connects
Your watchlists, tickers, briefs, notes, and the funds you follow, rendered as one force-directed graph.
ExploreWatchlists
Track every position in one place
Individual stocks across unlimited lists, each with the columns you choose, plus an events calendar and a full stock page behind every ticker.
ExploreMarkets
The whole market on one dashboard
One dashboard for the whole market, the market-wide earnings week with your stocks marked, and every stream across all tickers.
Explore
More comparisons
See how Brief Equity stacks up against the other tools investors consider.
Koyfin alternative
Brief Equity: a Koyfin alternative for focused equity research
A Koyfin alternative for stock research. A workspace with a feed, a research library, a knowledge graph, your own models, and 13F ownership fund by fund.
Read comparisonTIKR alternative
Brief Equity: a TIKR alternative for connected equity research
A TIKR alternative for connected research. A workspace for US and international stocks with a feed, a research library, a knowledge graph, and your own DCF and EV/EBITDA models.
Read comparisonYahoo Finance alternative
Brief Equity: a Yahoo Finance alternative for research you keep
A Yahoo Finance alternative for research you keep. A workspace for US and international stocks with one feed, a research library, a knowledge graph, your own models, and 13F ownership.
Read comparison