Valuation · EV/EBITDA model
Is Shopify (SHOP) stock overvalued?
Brief Equity's quick EV/EBITDA model of Shopify, dated October 14, 2026, puts the shares at about $104 for 2028, against a price of $171.70 that day. On those assumptions Shopify looks expensive, with the model's value about 40% below the price. The view rests on one condition: that revenue growth slows to 16% by 2028 and investors value Shopify at 40 times EBITDA that year.
By The Brief Equity Team · Model dated · Published
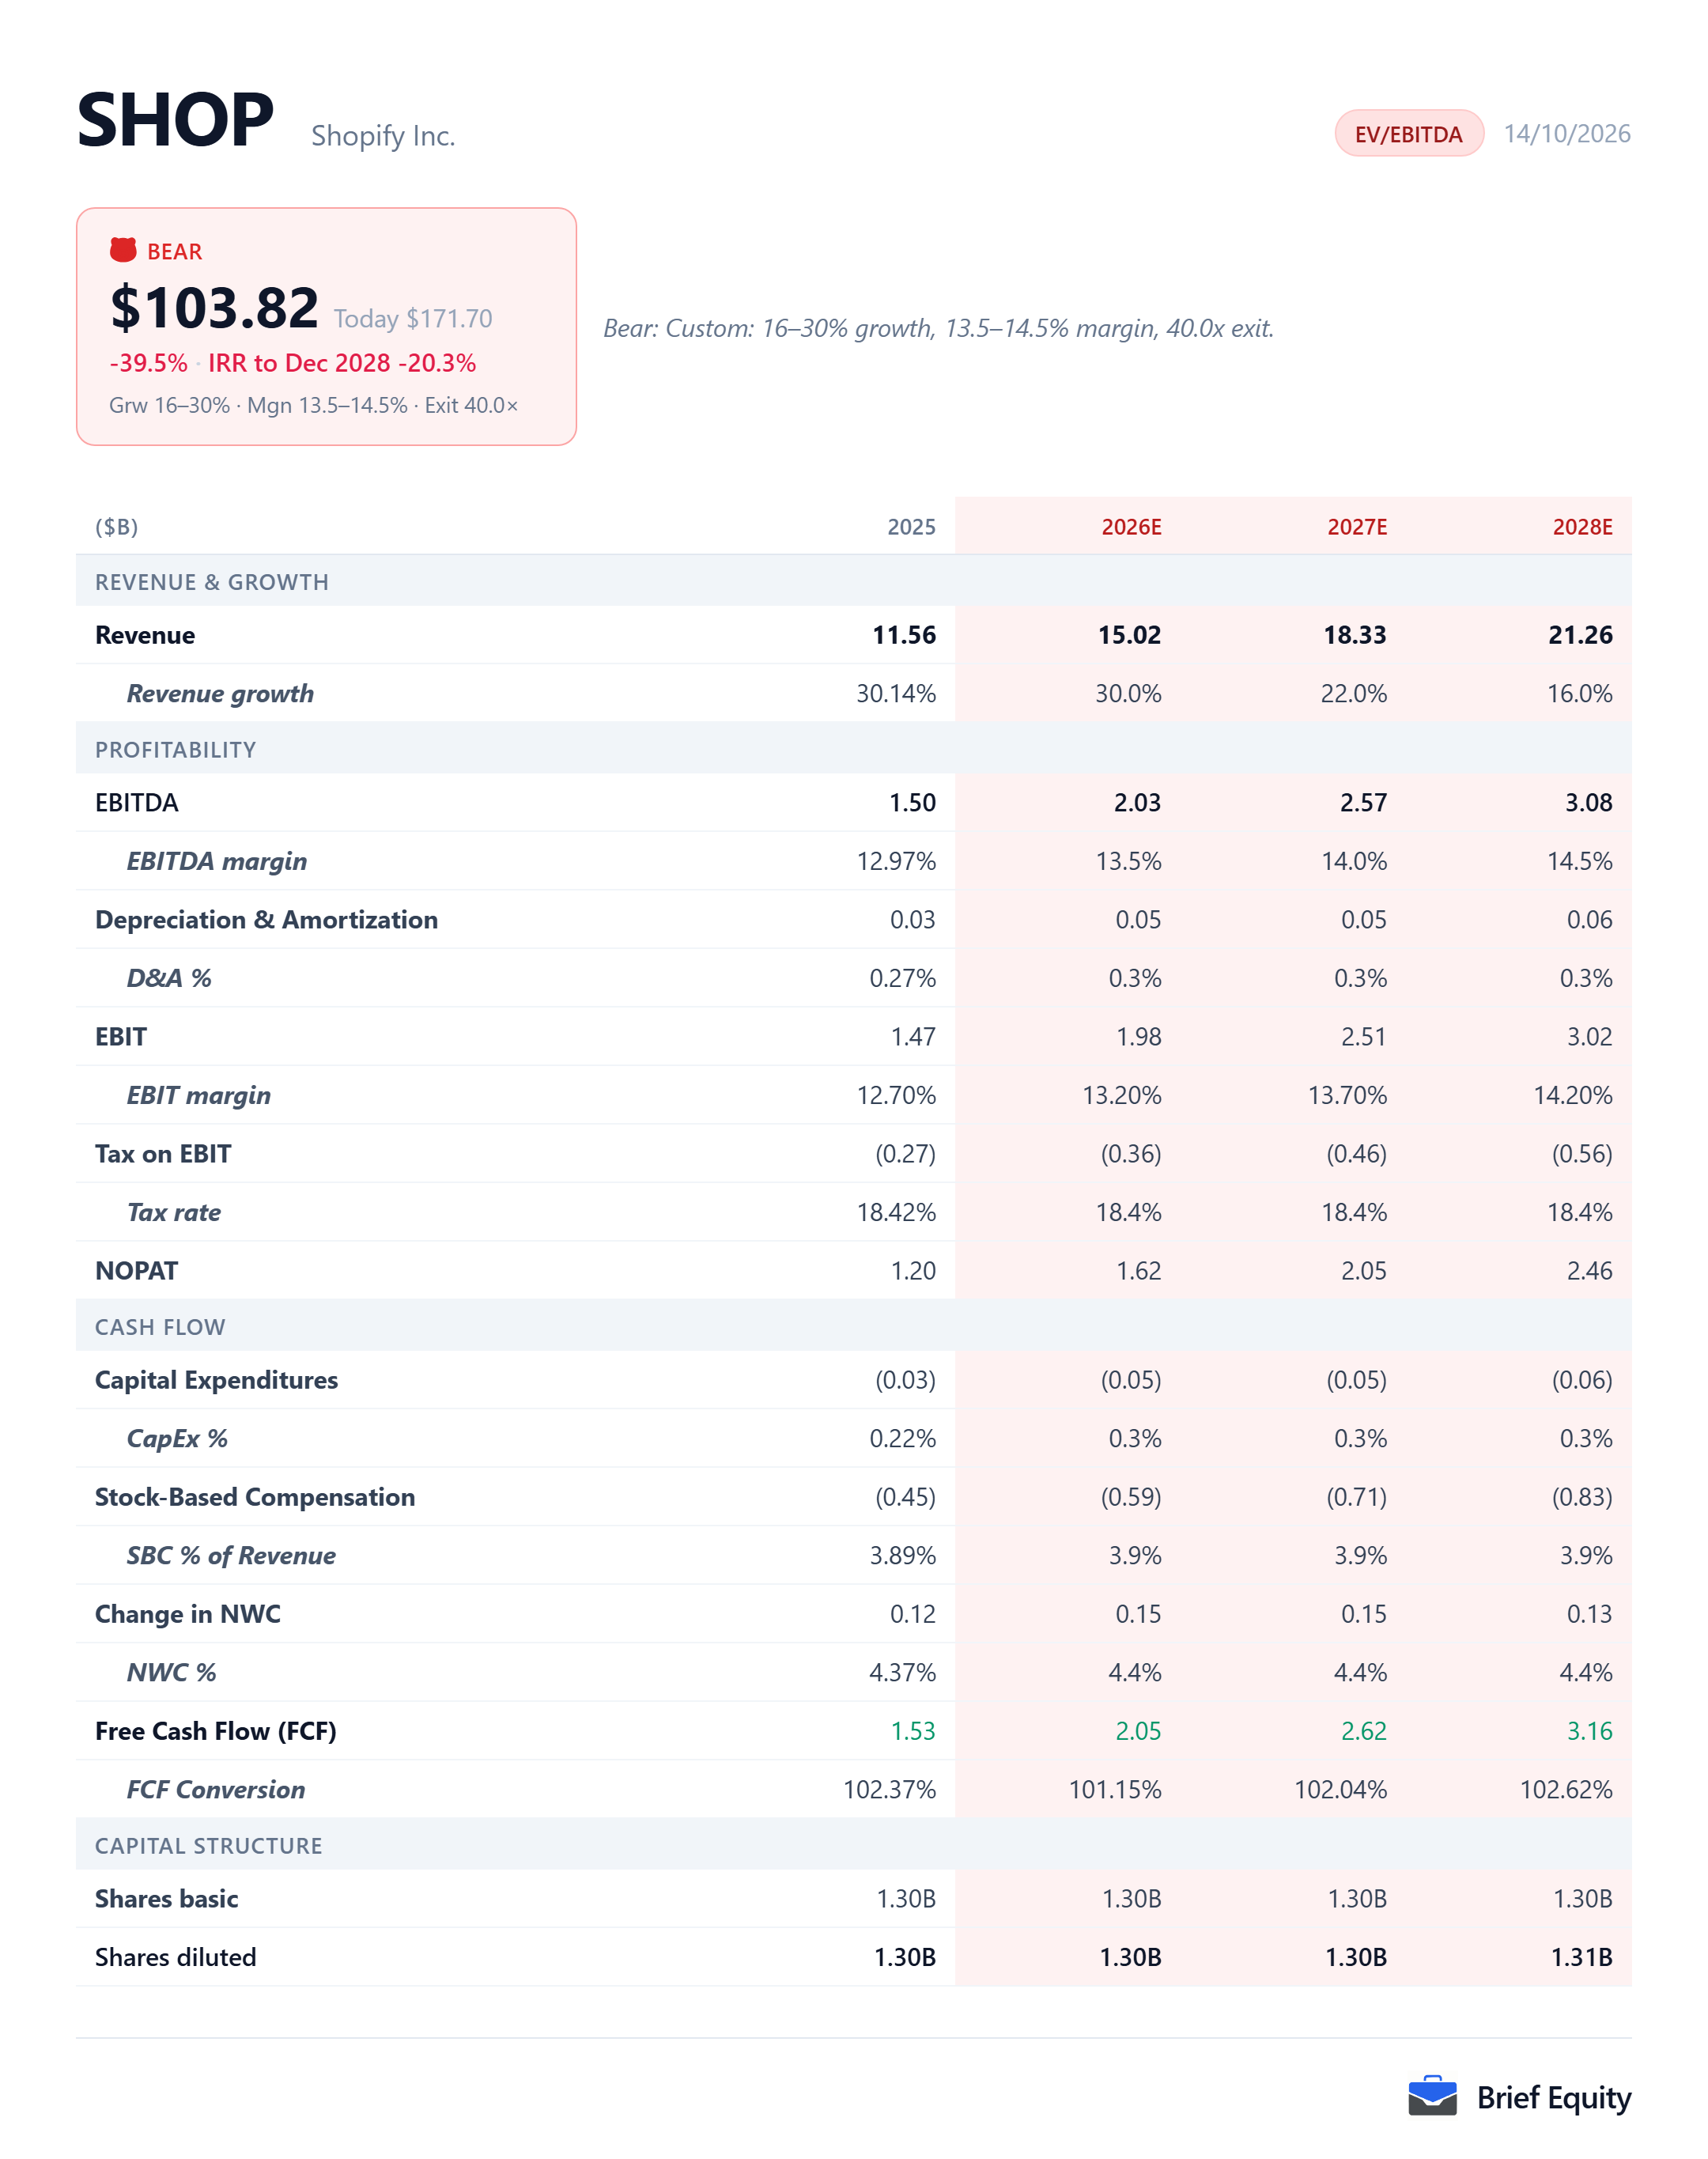
The model's assumptions for Shopify
Shopify's fiscal year is the calendar year. The model projects three years, to 2028, from a short list of stated assumptions, and analyst consensus revenue for the same three years is shown beside the model's revenue.
| 2026 | 2027 | 2028 | |
|---|---|---|---|
| Revenue, model | 15.02 | 18.33 | 21.26 |
| Revenue growth, model | 30.0% | 22.0% | 16.0% |
| EBITDA, model | 2.03 | 2.57 | 3.08 |
| EBITDA margin, model | 13.5% | 14.0% | 14.5% |
| 2026 | 2027 | 2028 | |
|---|---|---|---|
| Revenue, model | 15.02 | 18.33 | 21.26 |
| Revenue, analyst consensus | 15.07 | 18.99 | 23.93 |
Why Shopify looks overvalued
Shopify's growth now comes largely from payments, which earns a lower gross margin than its subscriptions. At $171.70, Shopify looks expensive on this model if its growth slows and investors stop valuing it at a software company's multiple.
In the second quarter of 2026, Shopify's revenue rose to $3,583 million from $2,680 million a year earlier, and Shopify Payments revenue alone rose by $624 million. In the first quarter, merchant solutions, the revenue line that includes Shopify Payments, earned a gross margin of 39%, against 80% for subscription solutions.
“The lower margins on merchant solutions compared to subscription solutions means that the continued growth of merchant solutions has caused in the past, and may cause in the future, a decline in our overall gross margin percentage.”
Shopify annual report (Form 10-K) for 2025, February 11, 2026
Shopify's gross profit was 48% of revenue in 2025, down from 50% in 2024.
Payments is also a crowded market. Shopify Payments itself depends on agreements with Stripe and PayPal, and on September 23, 2026 the shares fell as much as 7% after an image showed Meta Pay offered beside Shop Pay as a checkout option in Meta's Muse agent.
For now, Shopify's operating costs are absorbing the lower margin: operating income rose 68% in the second quarter of 2026, while revenue rose 34%.
The model has revenue growth slowing from 30% in 2026 to 22% in 2027 and 16% in 2028, against analyst consensus of 27.5% a year from 2025 to 2028. Its EBITDA margin rises only from 13.5% to 14.5%, and at 40 times EBITDA in 2028 the shares come to about $104, about 40% below the price.
What has to be true, and what would break it
Shopify looks expensive on this model only if a few things hold, and the view fails if they do not.
What has to be true
- Payments keeps providing most of Shopify's revenue growth, at a lower gross margin than subscriptions.
- Revenue growth slows from 30% in 2026 to 16% in 2028.
- The EBITDA margin rises only slowly, to 14.5% in 2028.
- Investors value Shopify at about 40 times EBITDA in 2028.
What would break it
- Operating costs keep falling as a share of revenue fast enough to lift the EBITDA margin well above 14.5%.
- Revenue growth stays near analyst consensus of 27.5% a year through 2028.
- Investors keep valuing Shopify's earnings at a software company's multiple.
The parts of Shopify's business
Shopify reports its revenue in two lines. Shopify Payments sits inside merchant solutions, together with lending, partner referral fees, shipping labels, point-of-sale hardware and advertising.
| Share of revenue | Share of revenue growth | |
|---|---|---|
| Merchant solutions | 76.2% | 85.0% |
| Subscription solutions | 23.8% | 15.0% |
Shopify beside its peers
Shopify is compared here with eight companies, chosen to cover its payments business, its financial services and its subscription software.
- XYZ: Seller software and payments, the closest match to merchant solutions
- TOST: Point-of-sale software and payments
- PYPL: Online checkout and wallet, and one of Shopify's two payment processors
- FISV: Merchant payments through Clover
- AFRM: Pay-over-time lending, against Shopify's lending and financial services
- MELI: A commerce marketplace with its own payments business
- WIX: Website and store builder sold on subscription, against subscription solutions
- GLBE: Cross-border checkout for merchants
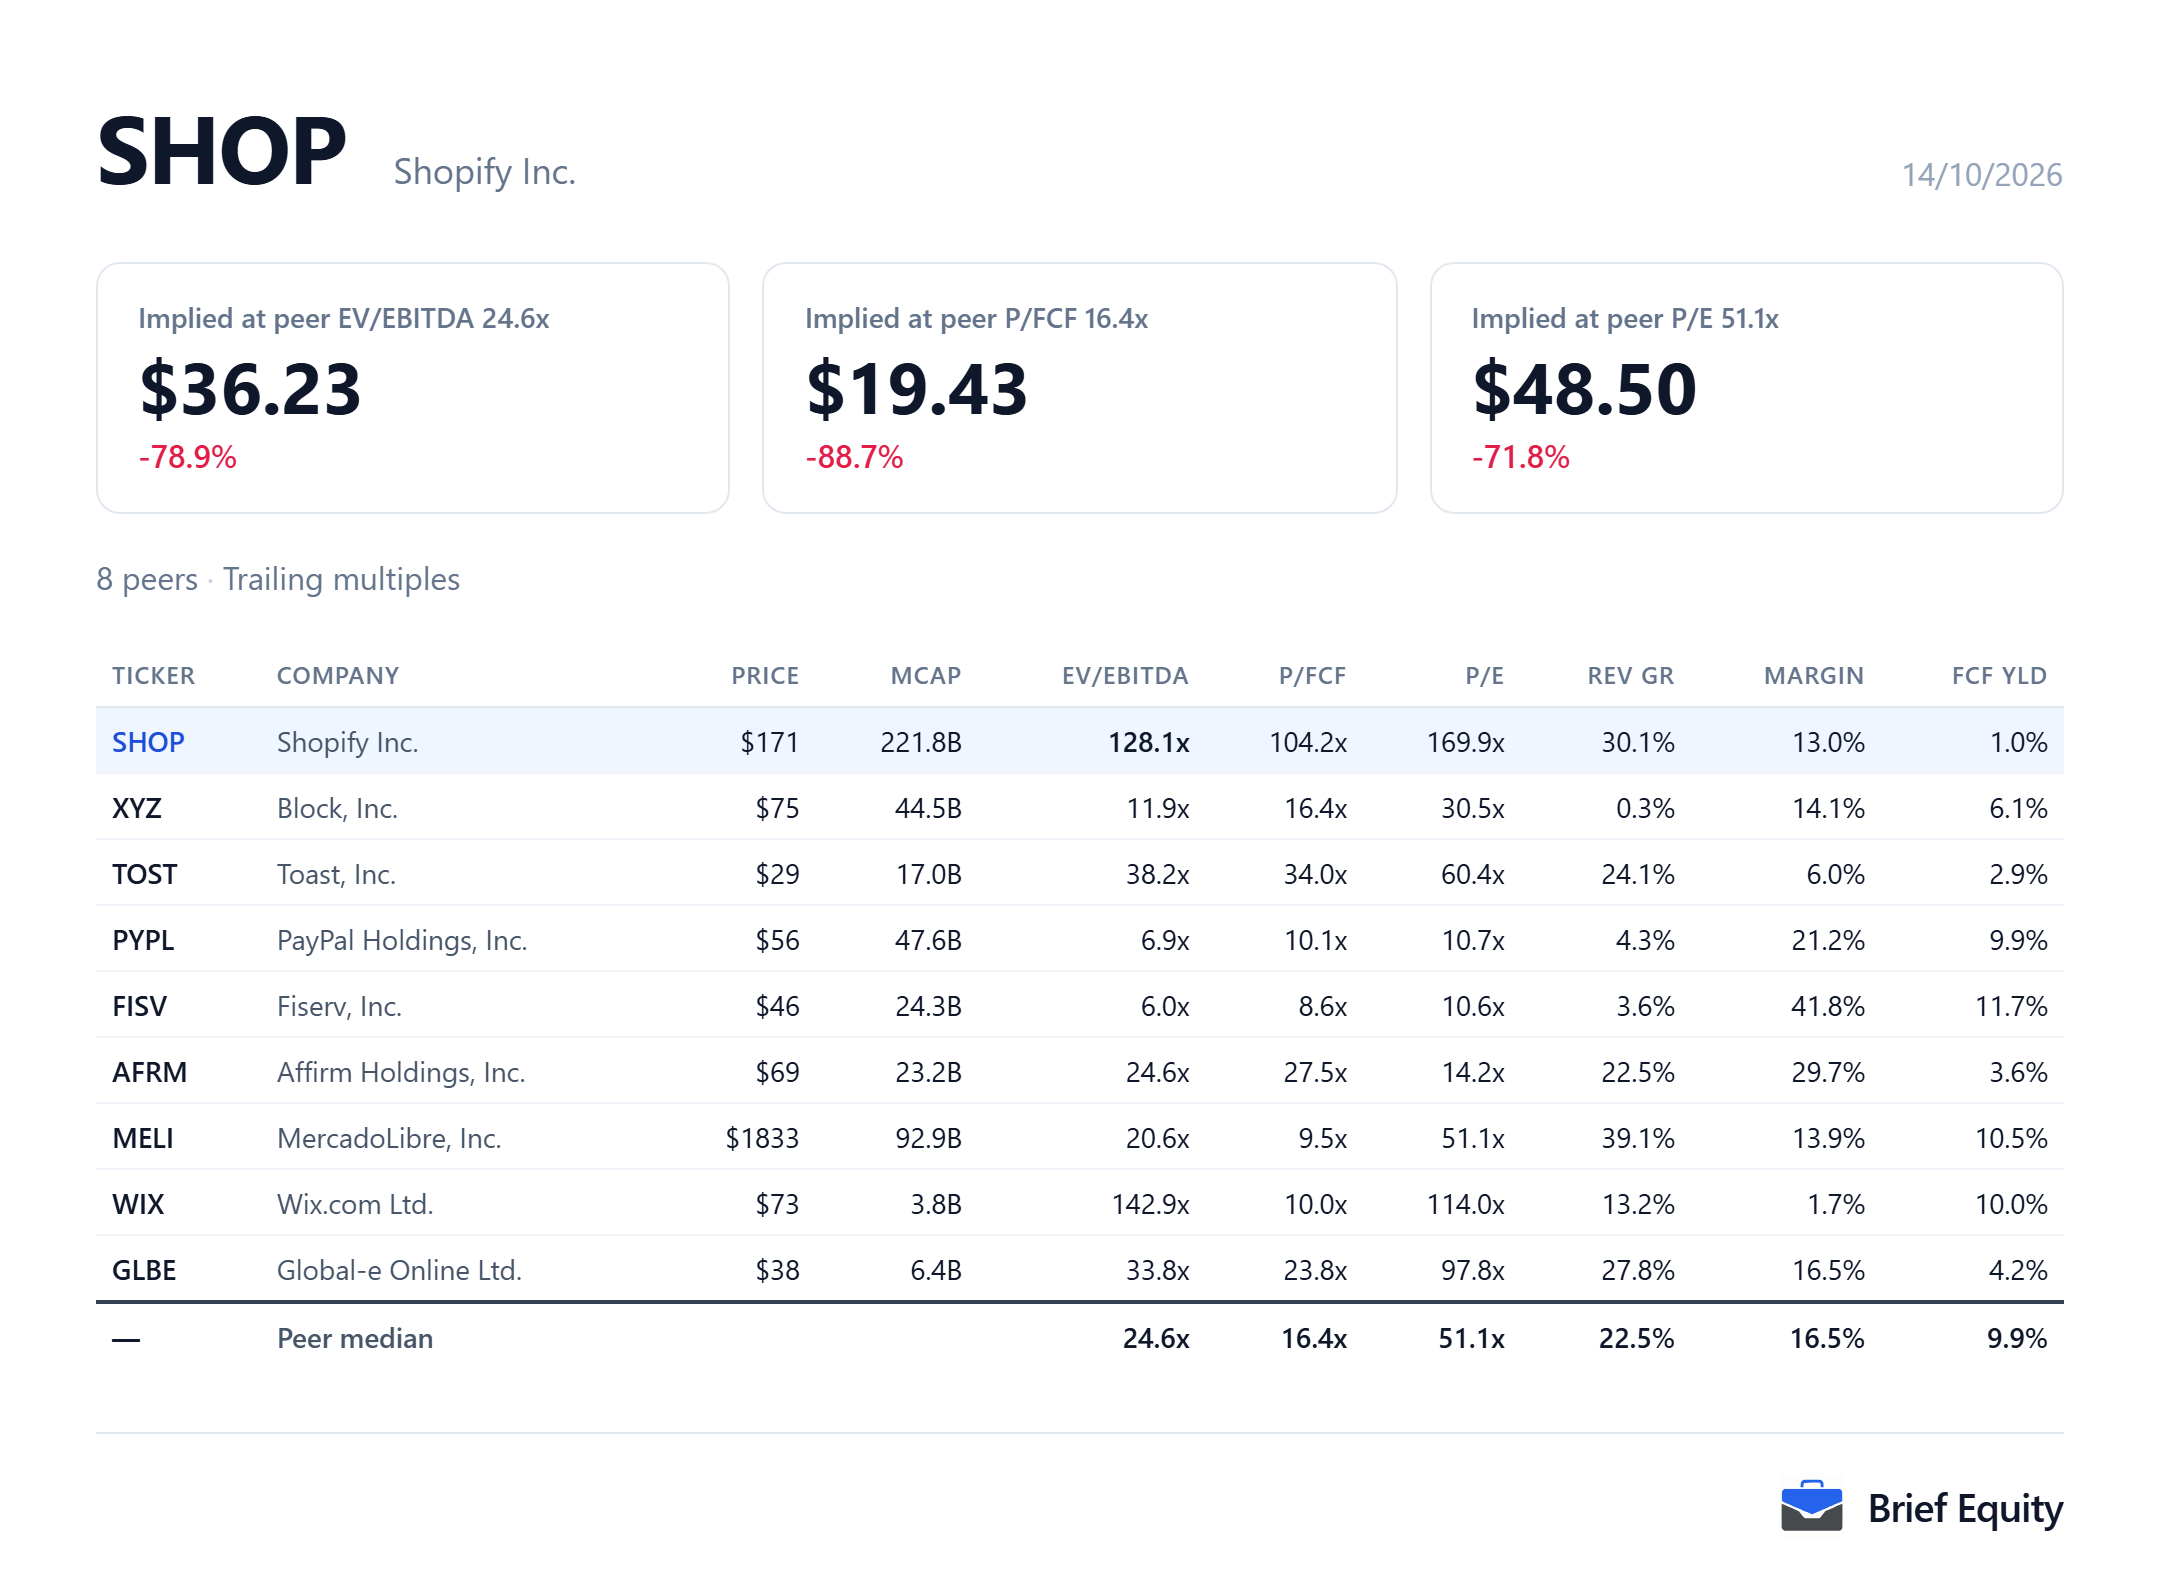
How the estimate moves with its assumptions
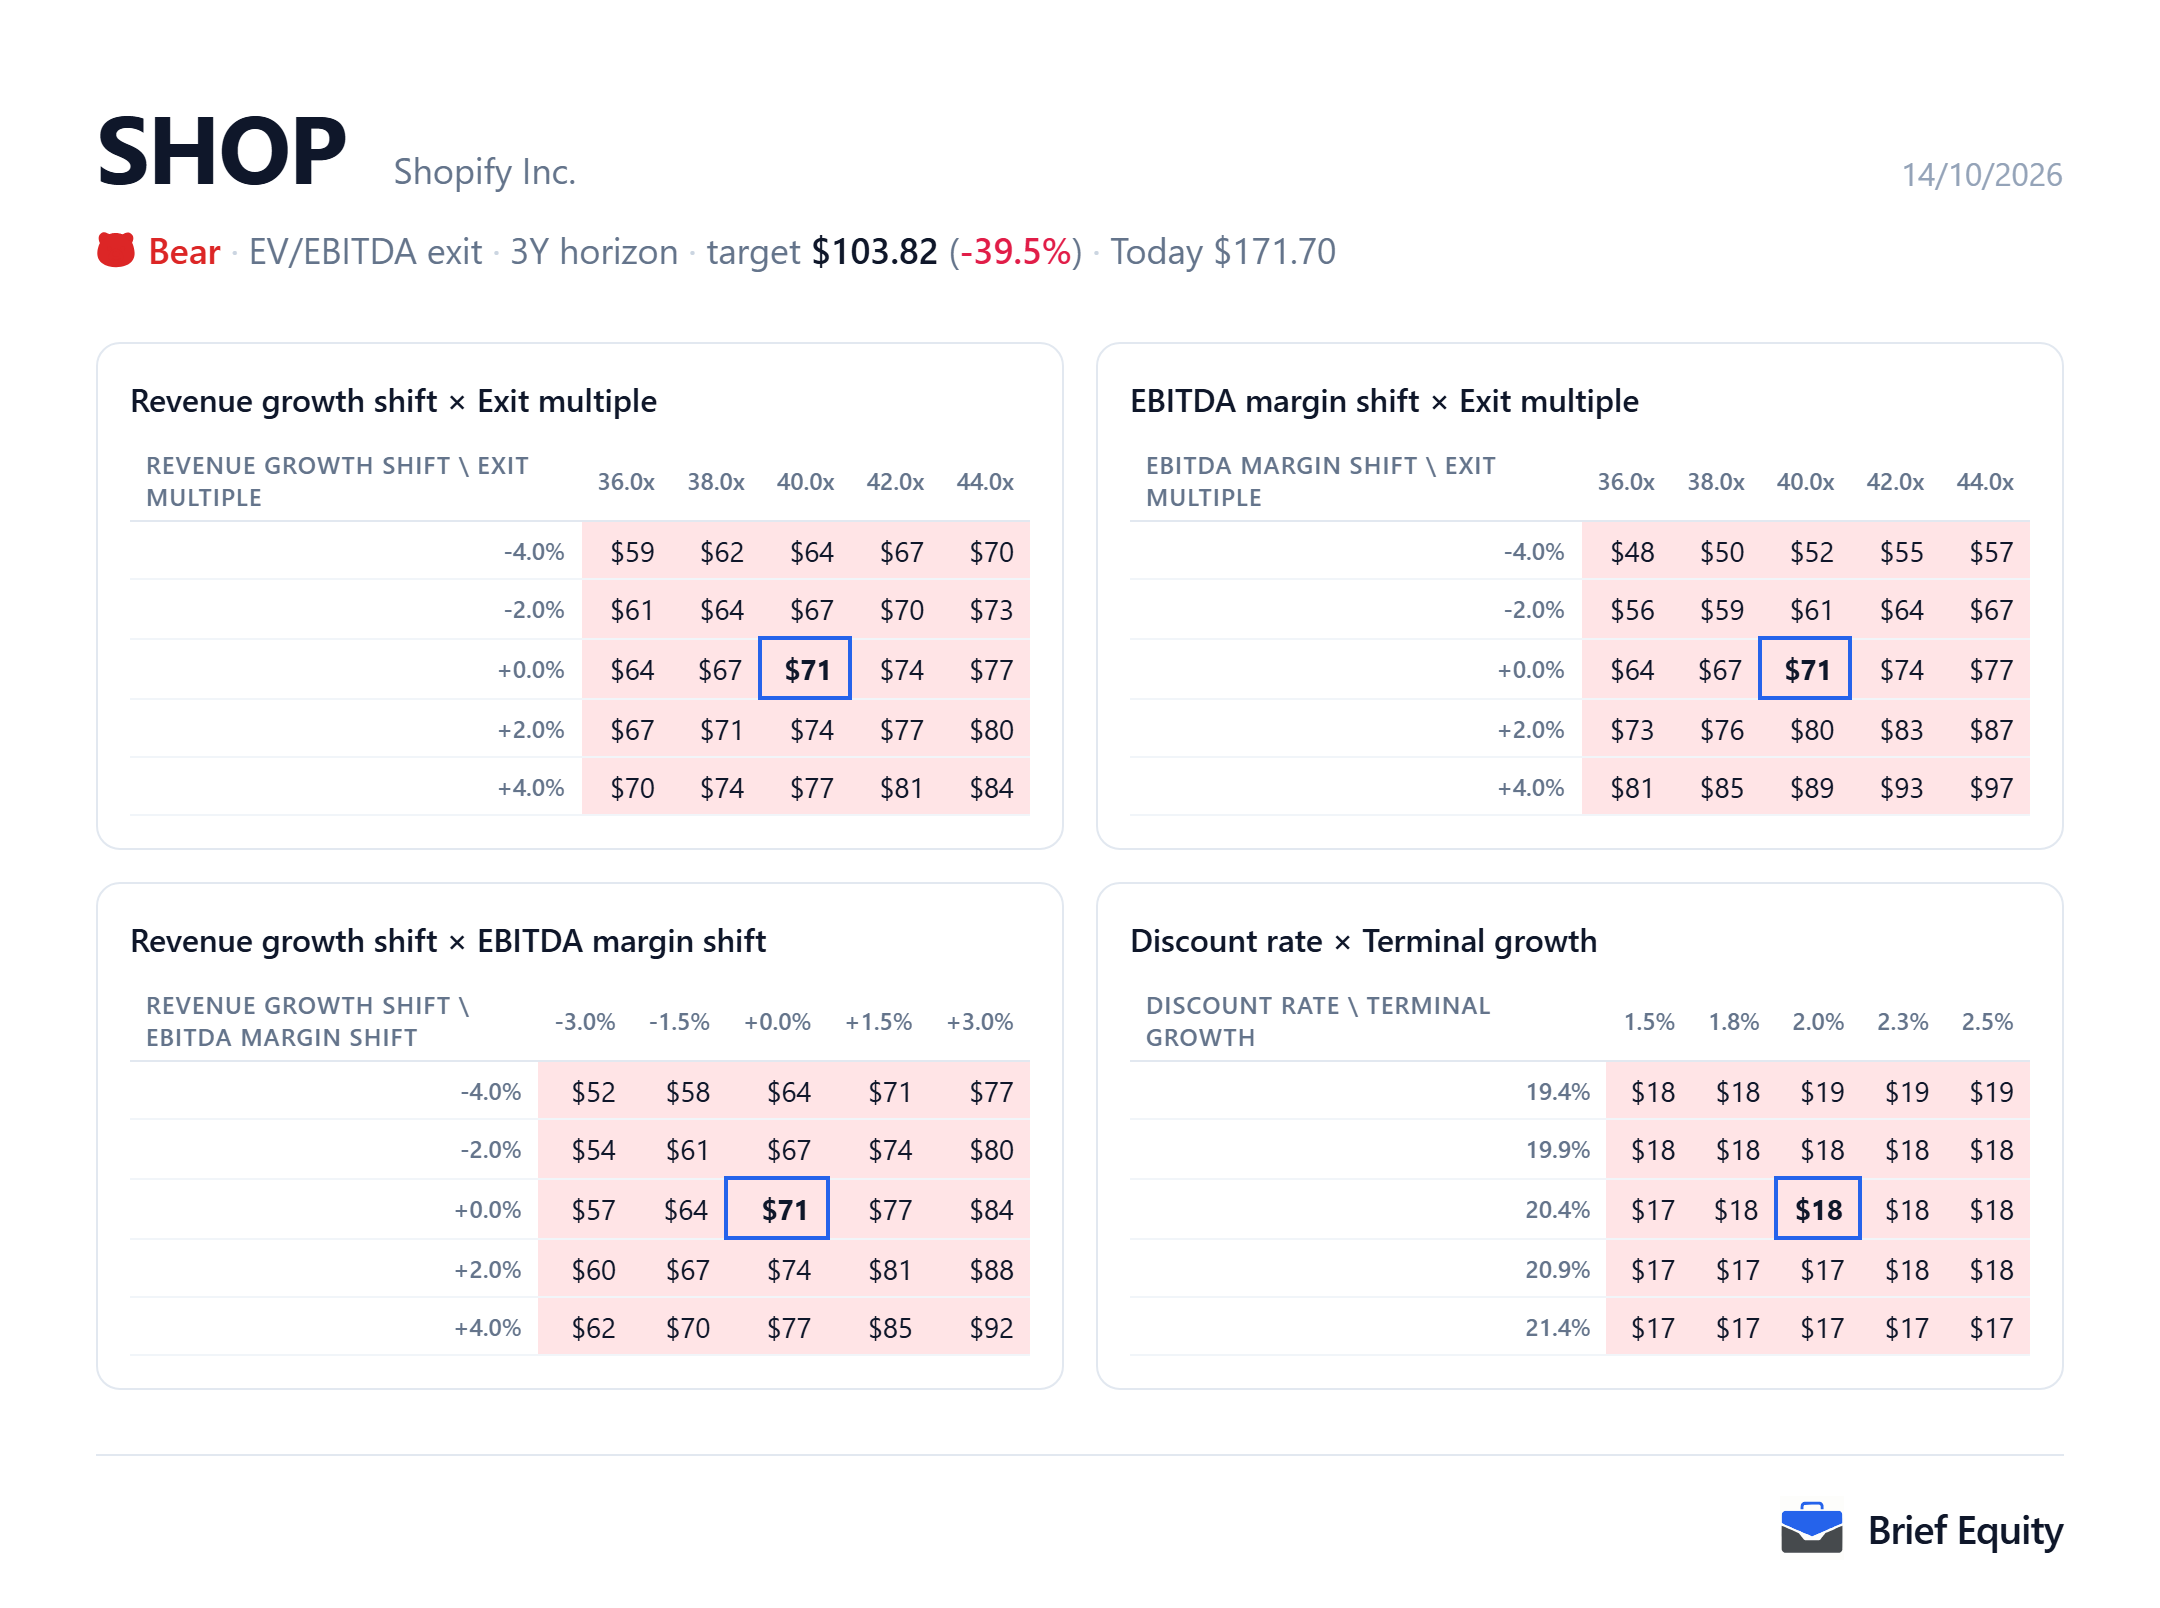
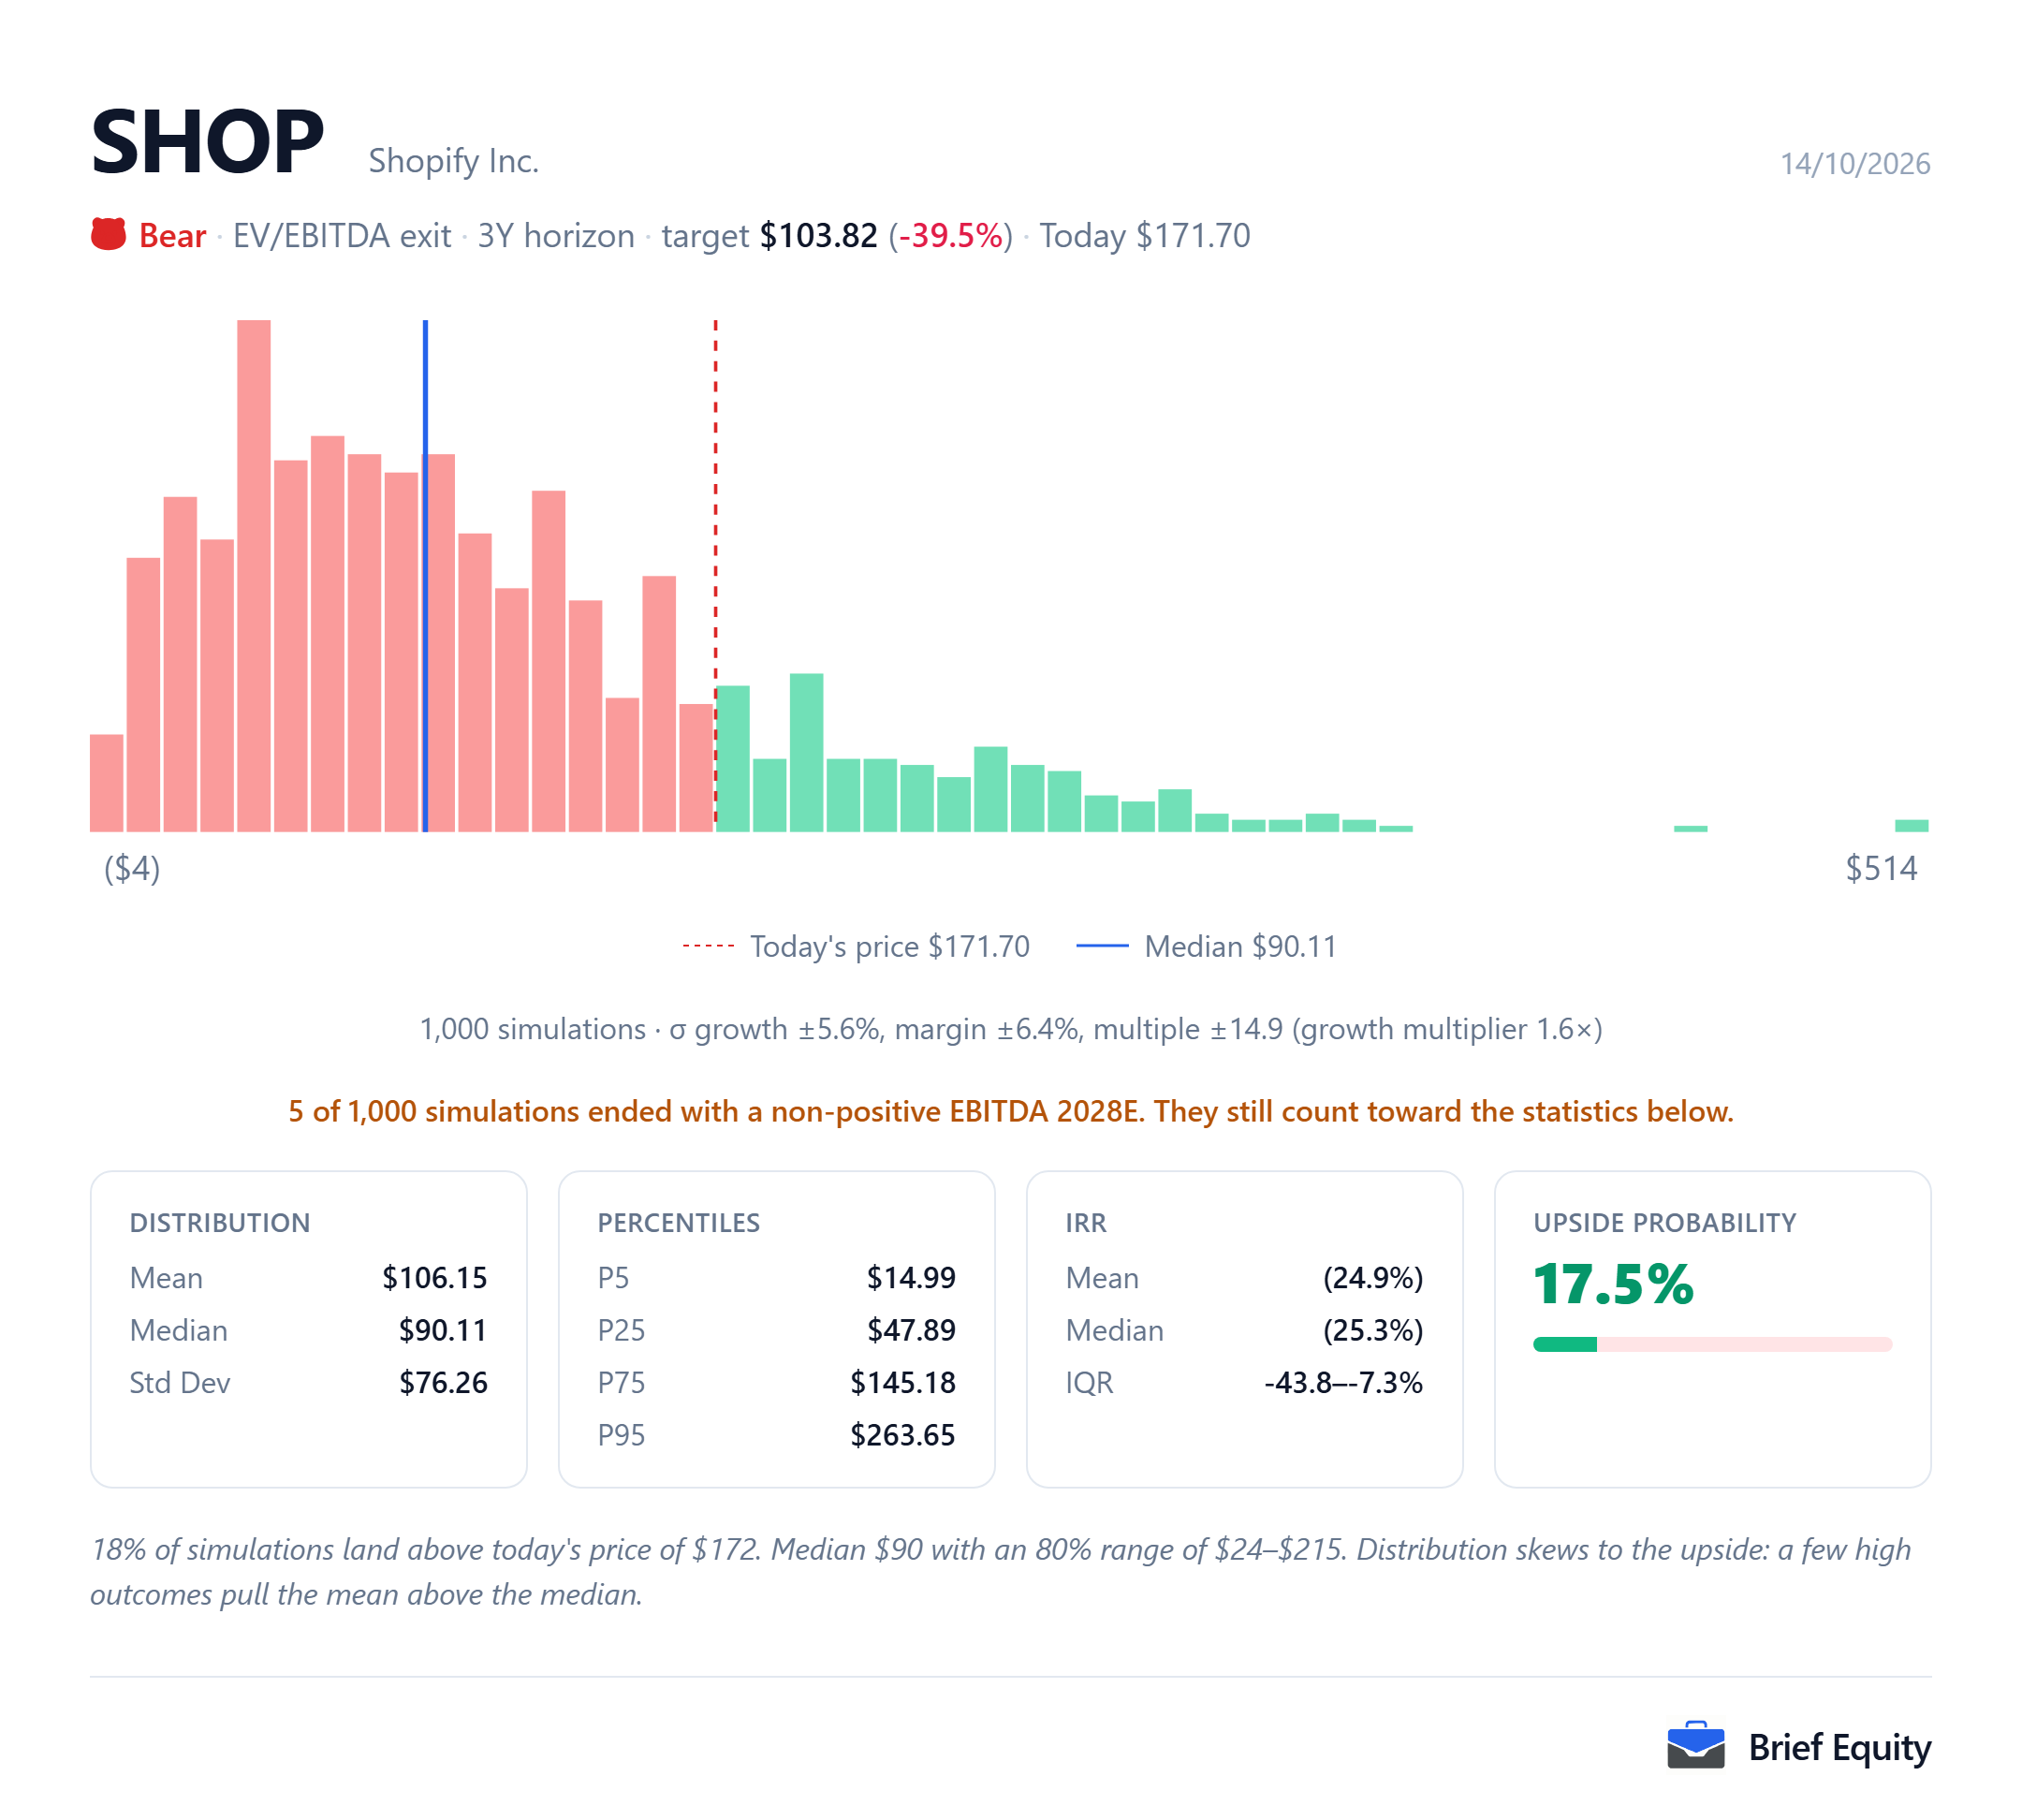
The Shopify estimate depends on each of its assumptions, and the two pictures below show how far it moves as they change. The first moves two assumptions at a time, and the second runs the model many times with growth, margin and the exit multiple drawn at random.
Questions about Shopify
These questions about Shopify (SHOP) are answered from the documents listed under Sources.
- Does Shopify have any debt?
- Shopify settled its convertible notes on November 3, 2025, and their net carrying amount at December 31, 2025 was nil.
- How much of Shopify's GMV runs through Shopify Payments?
- In the second quarter of 2026, 68% of Shopify's GMV, or $78.1 billion, was facilitated using Shopify Payments.
- Why does Shopify's net income swing so much from quarter to quarter?
- Shopify's net income includes gains and losses on its equity investments in other companies. In the second quarter of 2026, net income was $1,502 million, of which $1,063 million came from equity investments marked to market, net of taxes.
- Does Shopify buy back its shares?
- In the six months ended June 30, 2026, Shopify repurchased 16,859,976 Class A subordinate voting shares at an average price of $114.63, for $1,933 million.
- How large is Shopify's merchant loan book?
- Shopify's loans and merchant cash advances, net, were $2,184 million at June 30, 2026, against $1,784 million at December 31, 2025.
Sources
The quotations and facts about Shopify (SHOP) on this page rest on the documents below.
- Shopify annual report (Form 10-K) for 2025, February 11, 2026
- Shopify quarterly report (Form 10-Q) for the quarter ended June 30, 2026, August 5, 2026
- Shopify second-quarter 2026 earnings release, August 5, 2026
- Shopify first-quarter 2026 earnings call, May 5, 2026
- Shopify partners with Meta's Muse agent for checkout with Shop Pay, September 22, 2026
- Shopify shares fall after an image shows Meta Pay as a checkout option in Muse, September 23, 2026
About this page
Brief Equity and its team hold no position in Shopify (SHOP) as of October 14, 2026.
This page is research, not investment advice. It describes one model and the assumptions behind it, and market data is delayed. Read how these models are built and our editorial policy.
Related guides: EV/EBITDA explained, What is enterprise value (EV), How to read a 10-K (SEC filing).