Valuation · EV/EBITDA model
Is Samsung Electronics (005930.KS) stock undervalued?
Brief Equity's EV/EBITDA model of Samsung Electronics (005930.KS), dated October 15, 2026, puts the shares at KRW 722,411 by 2028, about 244% above the KRW 210,000.00 share price at that date. The stock looks undervalued if the shortage of memory chips lasts through 2028, as Samsung itself expects, and its EBITDA margin stays between 52.0% and 56.4%.
By The Brief Equity Team · Model dated · Published
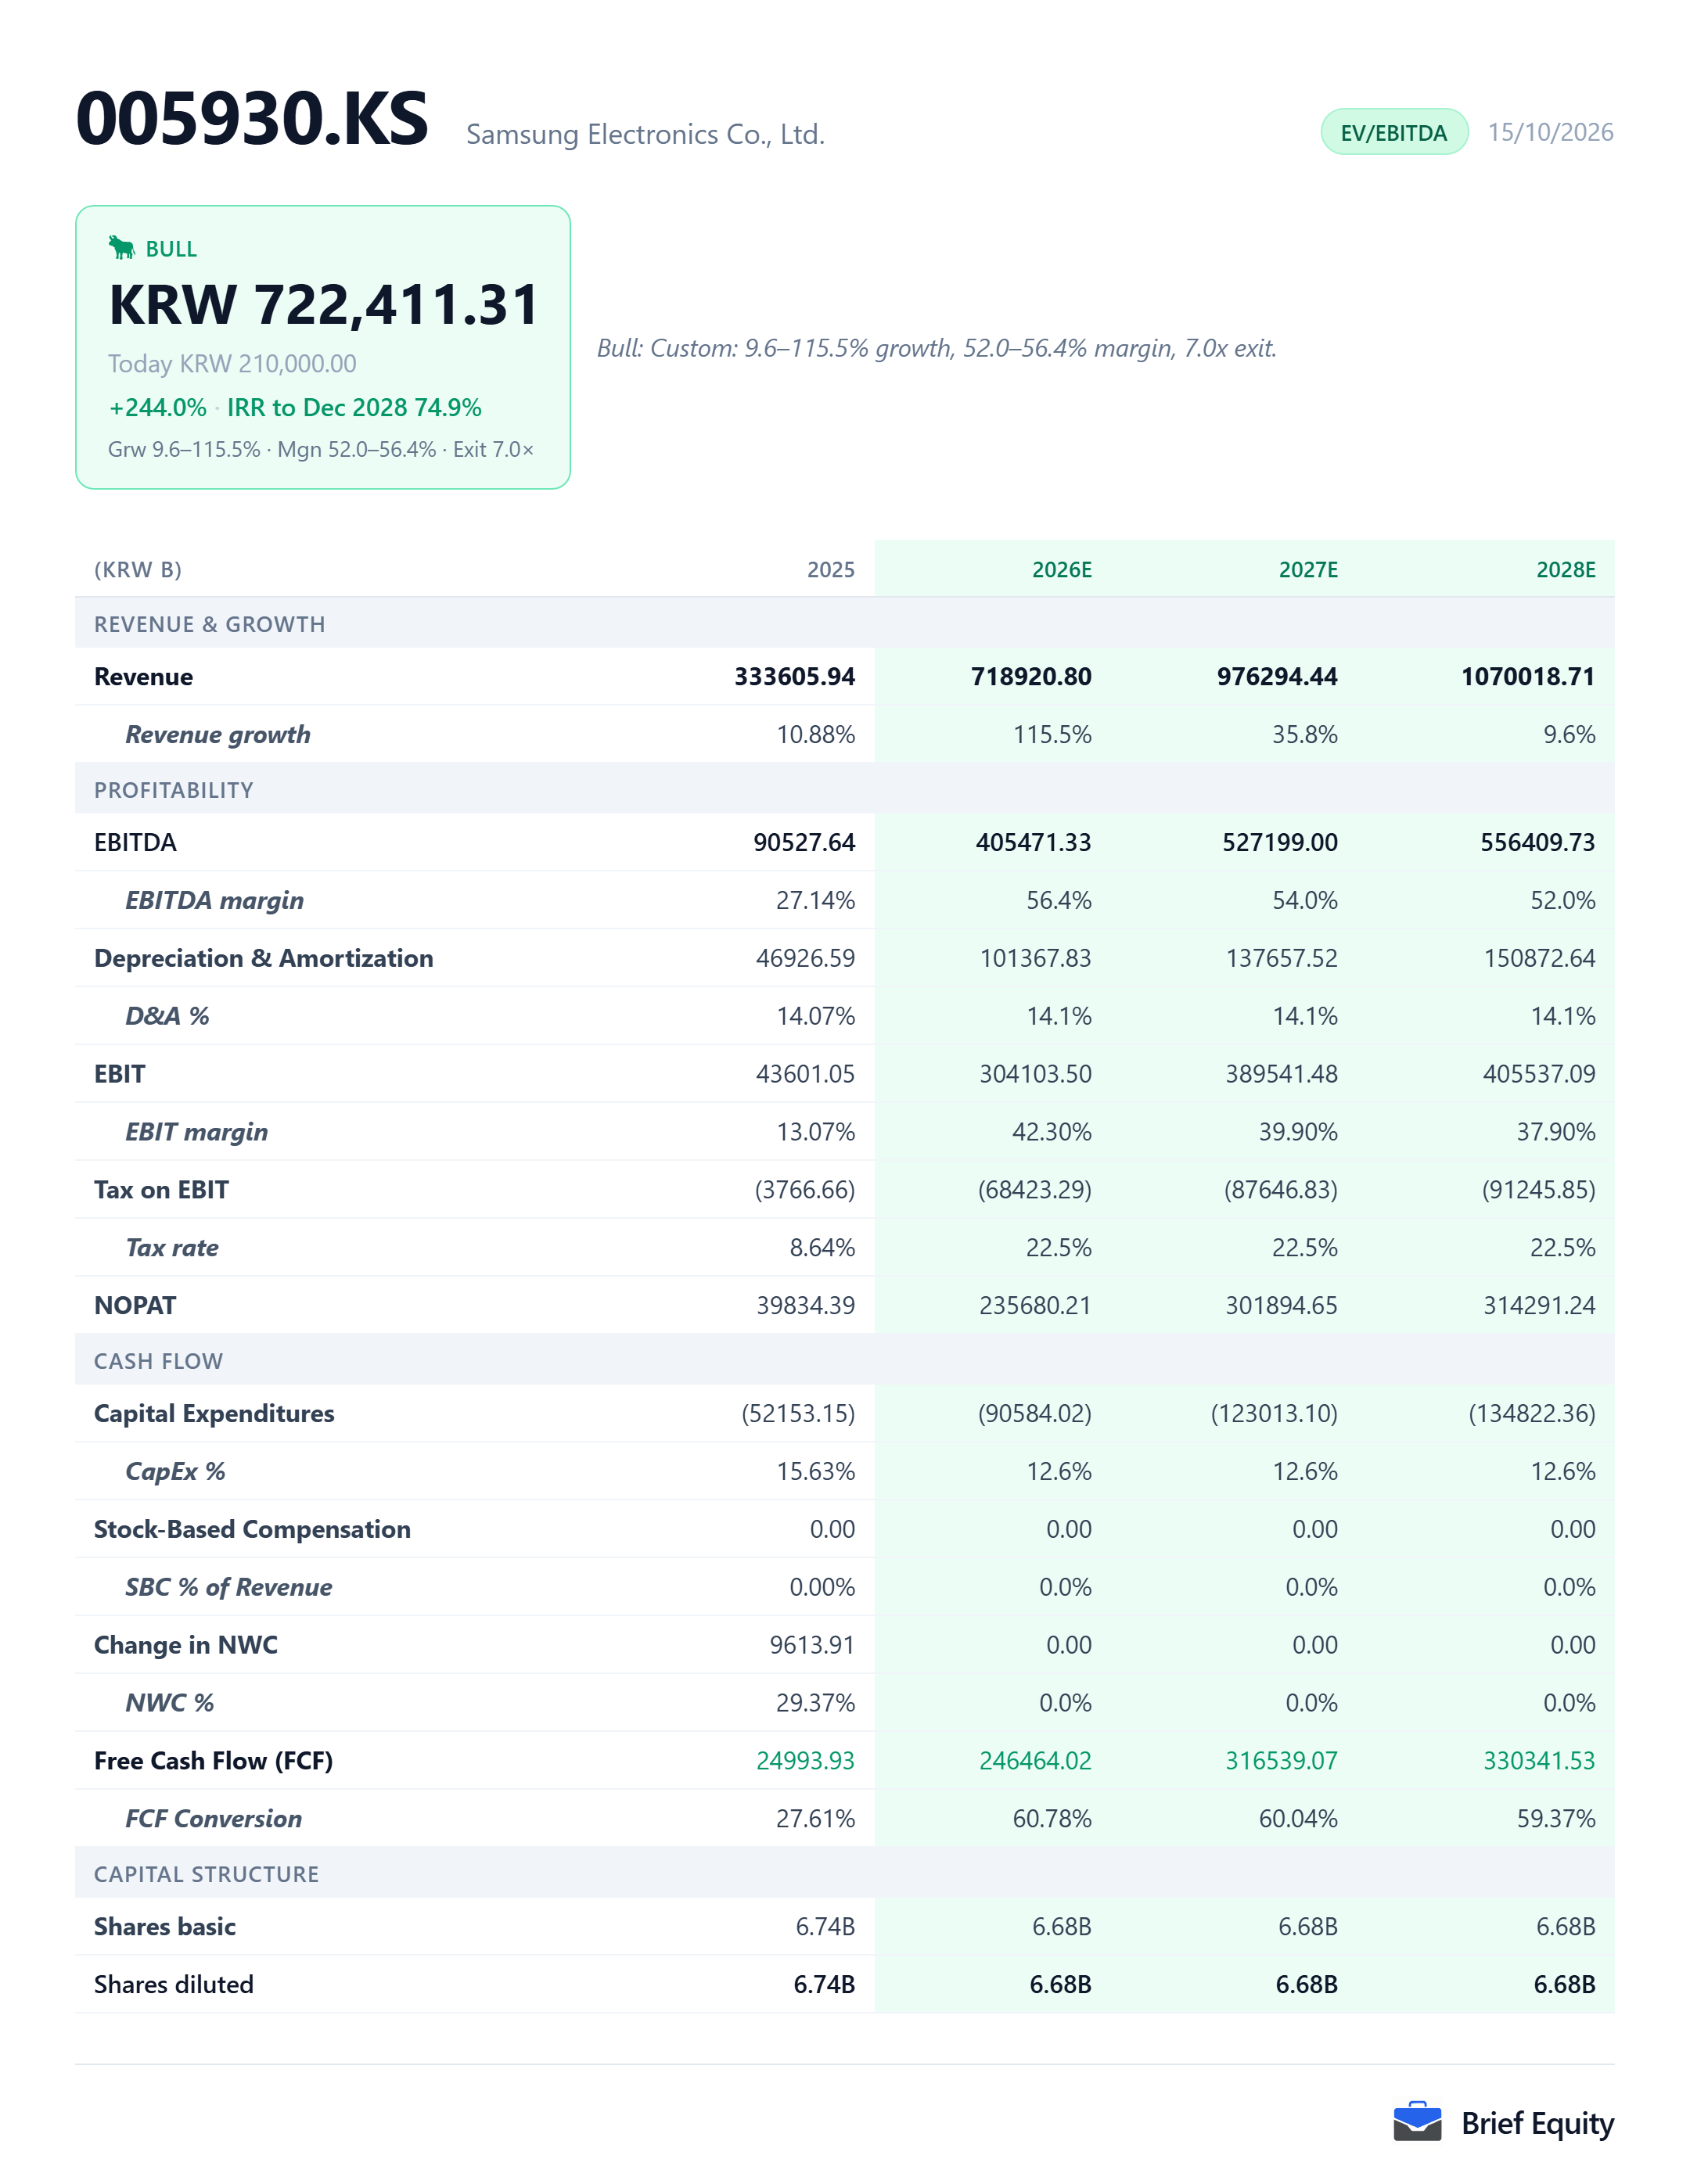
The model's assumptions for Samsung Electronics
Samsung Electronics' fiscal year is the calendar year, and it reports in Korean won under K-IFRS. The figures come from a quick model, built on a small set of stated assumptions and projected over three years. Revenue follows the analysts' consensus, and the EBITDA margin starts at 56.4% in 2026 and eases in the two years after.
| 2026 | 2027 | 2028 | |
|---|---|---|---|
| Revenue, model | 718920.80 | 976294.44 | 1070018.71 |
| Revenue growth, model | 115.5% | 35.8% | 9.6% |
| EBITDA, model | 405471.33 | 527199.00 | 556409.73 |
| EBITDA margin, model | 56.4% | 54.0% | 52.0% |
| Revenue, analysts' consensus | 719008.33 | 976460.45 | 1070271.89 |
Why Samsung Electronics looks undervalued
Samsung Electronics says no significant new supply of memory chips is likely to arrive through 2028. Its shares have nonetheless fallen from an intraday high of KRW 374,500 on June 19, 2026 to KRW 210,000 on October 15, 2026, and at that price they look undervalued, provided the memory market stays this tight through 2028.
“So we believe it will be unlikely to see any significant increase in incremental supply through 2028.”
Jaejune Kim, Head of the Global Sales and Marketing Office for Memory, Samsung Electronics second-quarter 2026 earnings call, July 29, 2026
Samsung Electronics is also signing memory supply agreements that run for five years. It has finalized them with the top five global data center customers and is in the final stages of talks with five more, and once those close it expects 60% to 70% of its planned DRAM and NAND capacity to be covered by such contracts. Customers make advance payments, mainstream products carry minimum price floors, and the company says the aim is to move away from a business that was overexposed to supply and demand cycles.
Samsung Electronics' profits have risen sharply. Its preliminary operating profit for the third quarter of 2026 was approximately KRW 107.40 trillion, against KRW 12.17 trillion a year earlier, and its operating margin rose from 21% in the fourth quarter of 2025 to 43% in the first quarter of 2026 and 52% in the second.
Brief Equity's model of Samsung Electronics takes the analysts' consensus for revenue: growth of 115.5% in 2026, 35.8% in 2027 and 9.6% in 2028. Its EBITDA margin eases from 56.4% in 2026 to 54.0% in 2027 and 52.0% in 2028, below the consensus of 63.1% for 2027 and 62.8% for 2028. At 7 times 2028 EBITDA, the model puts Samsung Electronics' shares at KRW 722,411 by 2028, about 244% above the price at the model's date.
Samsung Electronics' memory price increases are slowing. Its average DRAM selling price rose by a percentage in the low 90s in the first quarter of 2026 and in the mid-40s in the second quarter, each against the quarter before, and TrendForce expects contract prices for conventional DRAM to rise 10% to 15% in the fourth quarter.
Samsung Electronics also faces new capacity from China. CXMT plans to add capacity for 100,000 wafers a month in 2027 and another 100,000 in 2028, and it plans to launch a denser server DRAM chip by the end of 2026. Memory makers' shares reacted to that plan, and Samsung's fell 7.39% on October 13, 2026.
What has to be true, and what would break it
The estimate for Samsung Electronics rests on the conditions below, and any one of them can fail.
What has to be true
- Memory supply stays short through 2028, as Samsung expects.
- The five-year supply agreements close as planned, and their minimum price floors hold.
- Revenue grows 115.5% in 2026, 35.8% in 2027 and 9.6% in 2028, in line with the analysts' consensus.
- The EBITDA margin stays between 52.0% and 56.4% through 2028.
- The market values Samsung at 7 times EBITDA at the end of 2028.
What would break it
- Memory price increases keep slowing and turn into declines.
- New capacity from CXMT and other memory makers ends the shortage before 2028.
- The EBITDA margin falls back toward its 2025 level of 27.14%.
Samsung Electronics beside its peers
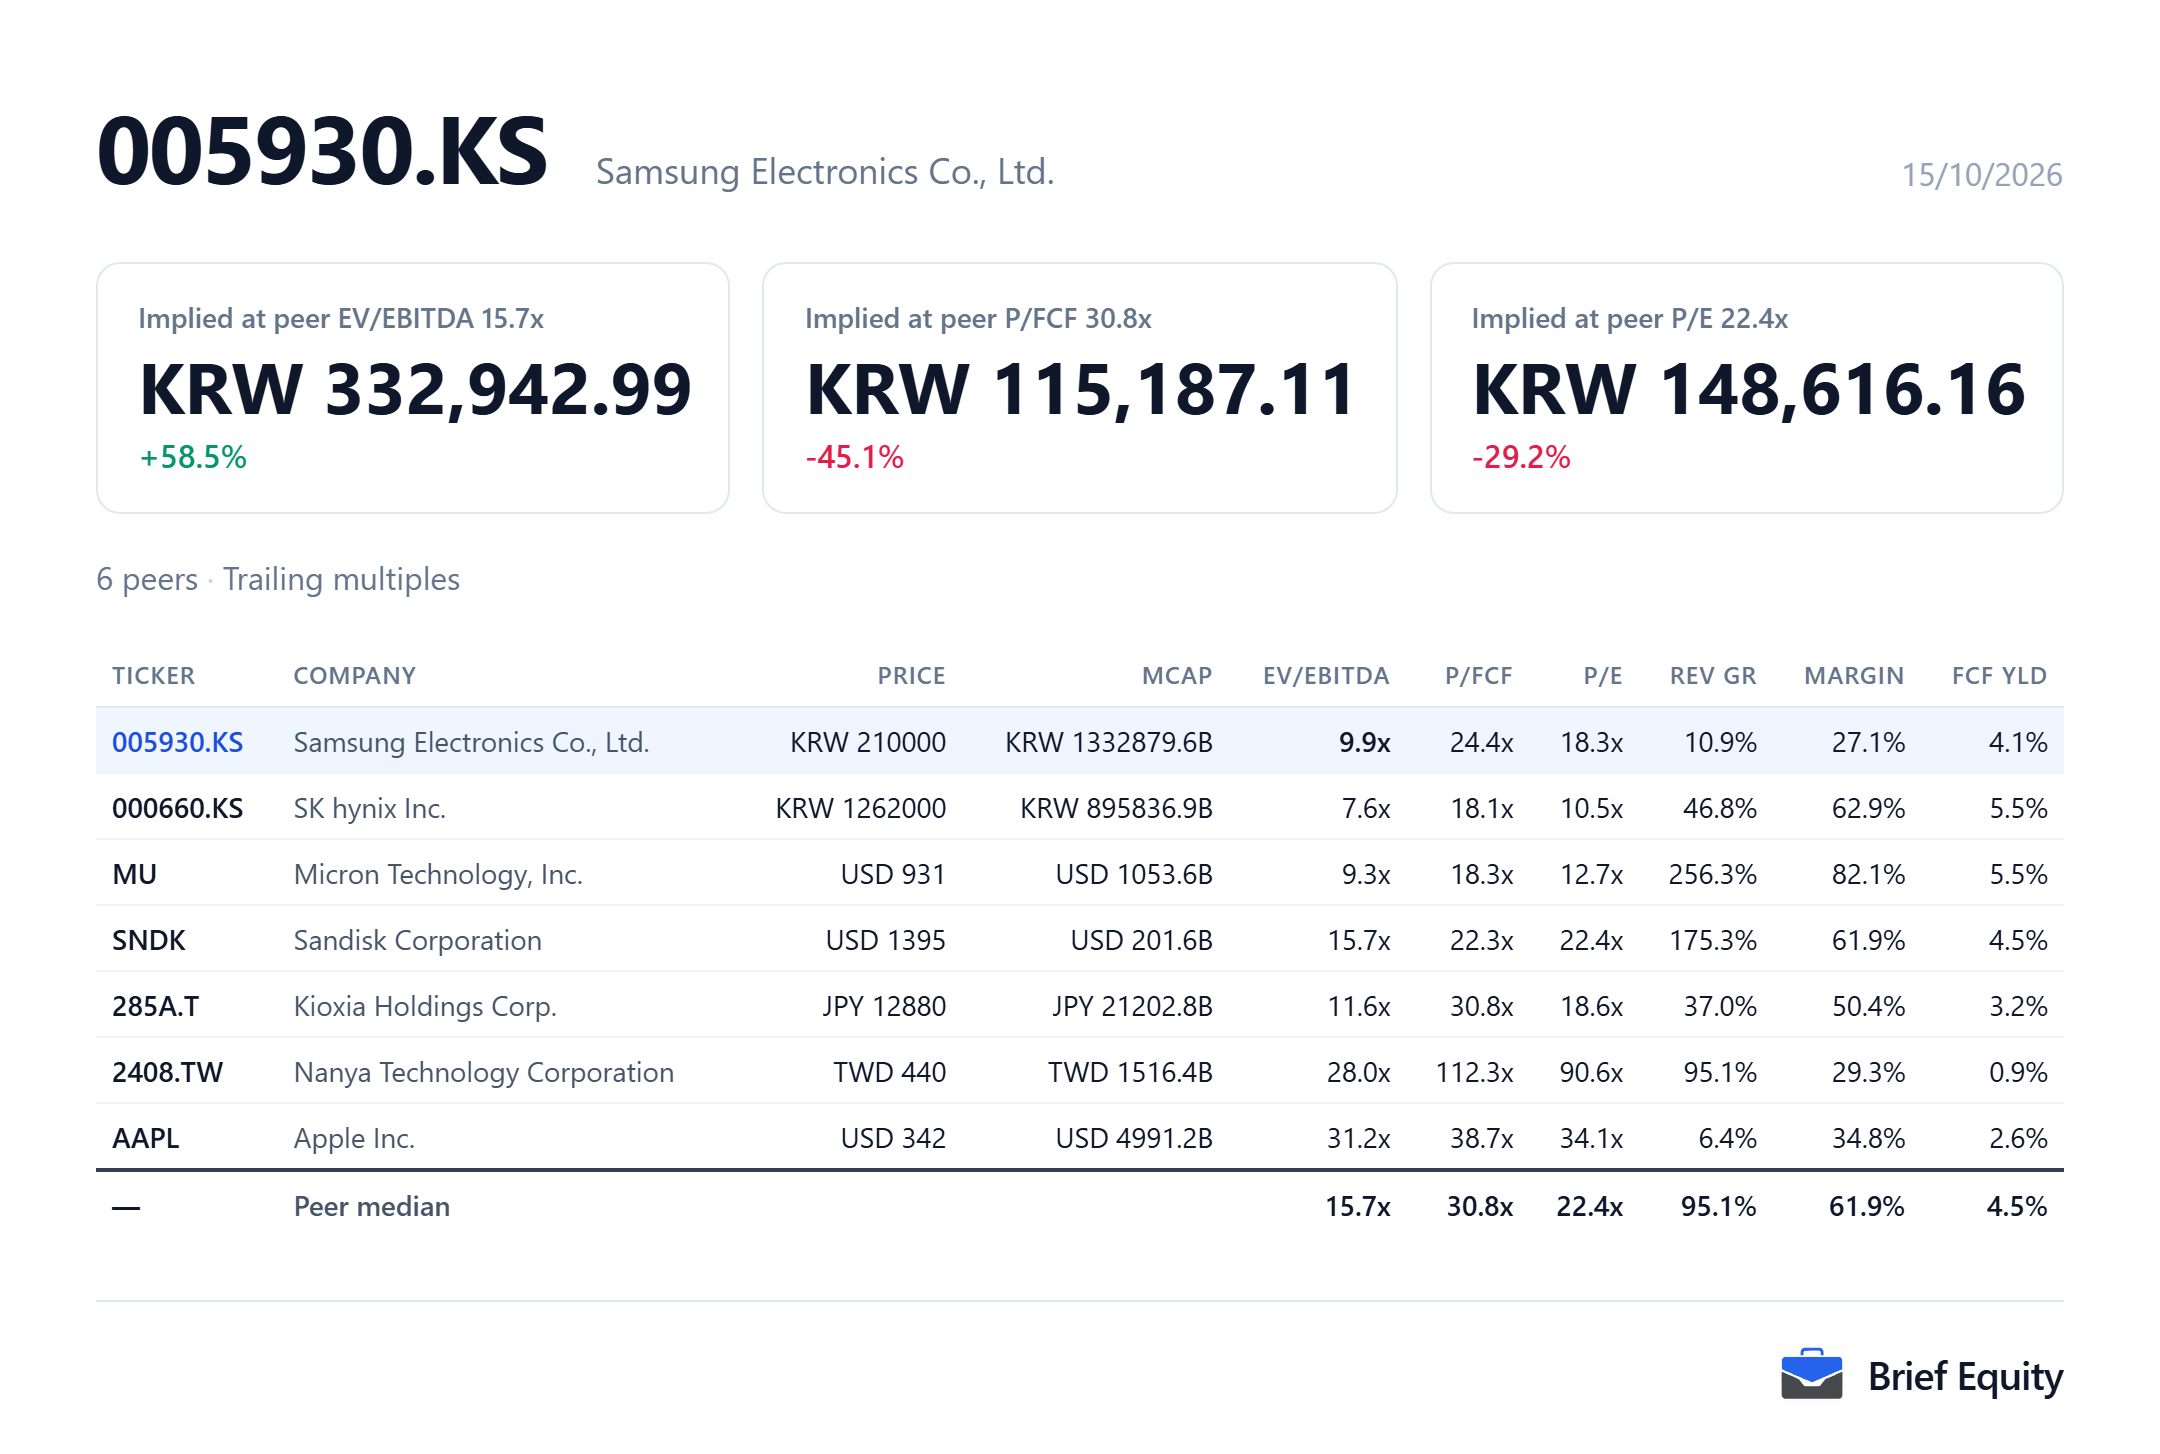
Samsung Electronics is compared with five makers of memory and storage chips, and with Apple for its smartphones.
- 000660.KS: memory chips: DRAM and high-bandwidth memory
- MU: memory chips: DRAM, high-bandwidth memory and NAND flash
- SNDK: NAND flash storage
- 285A.T: NAND flash storage
- 2408.TW: DRAM
- AAPL: smartphones, against the Galaxy range
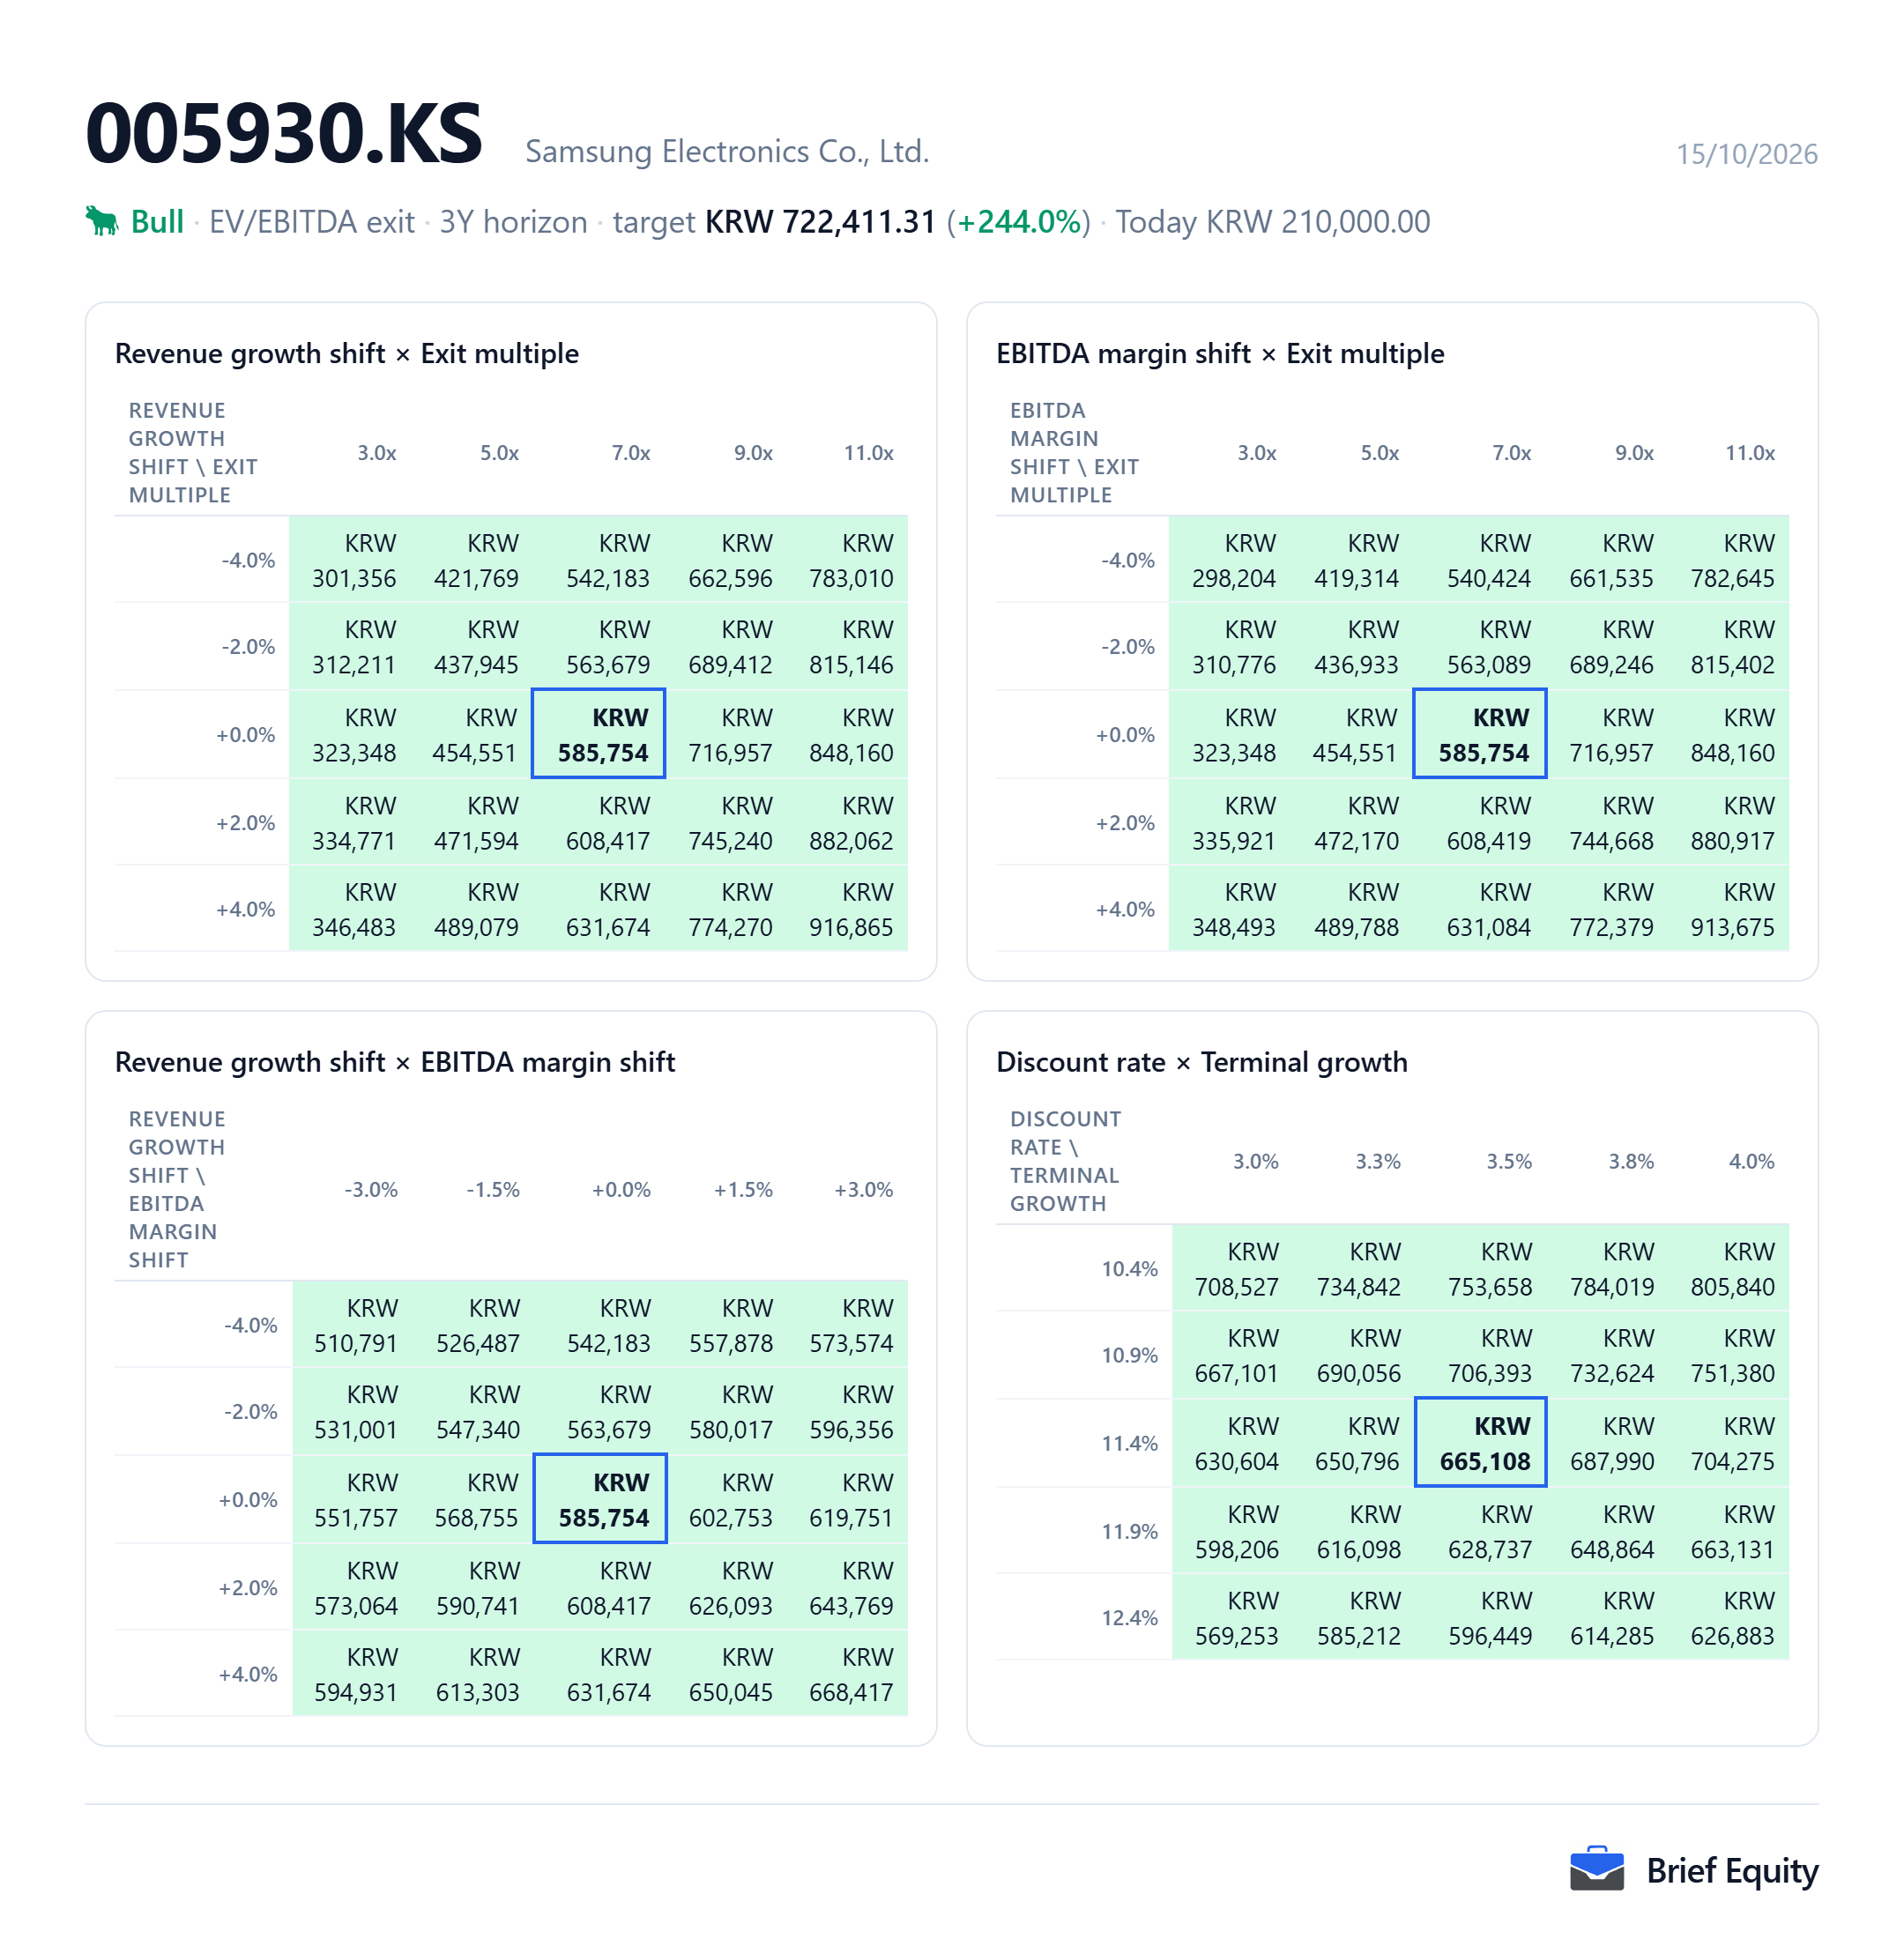
How the estimate moves with its assumptions
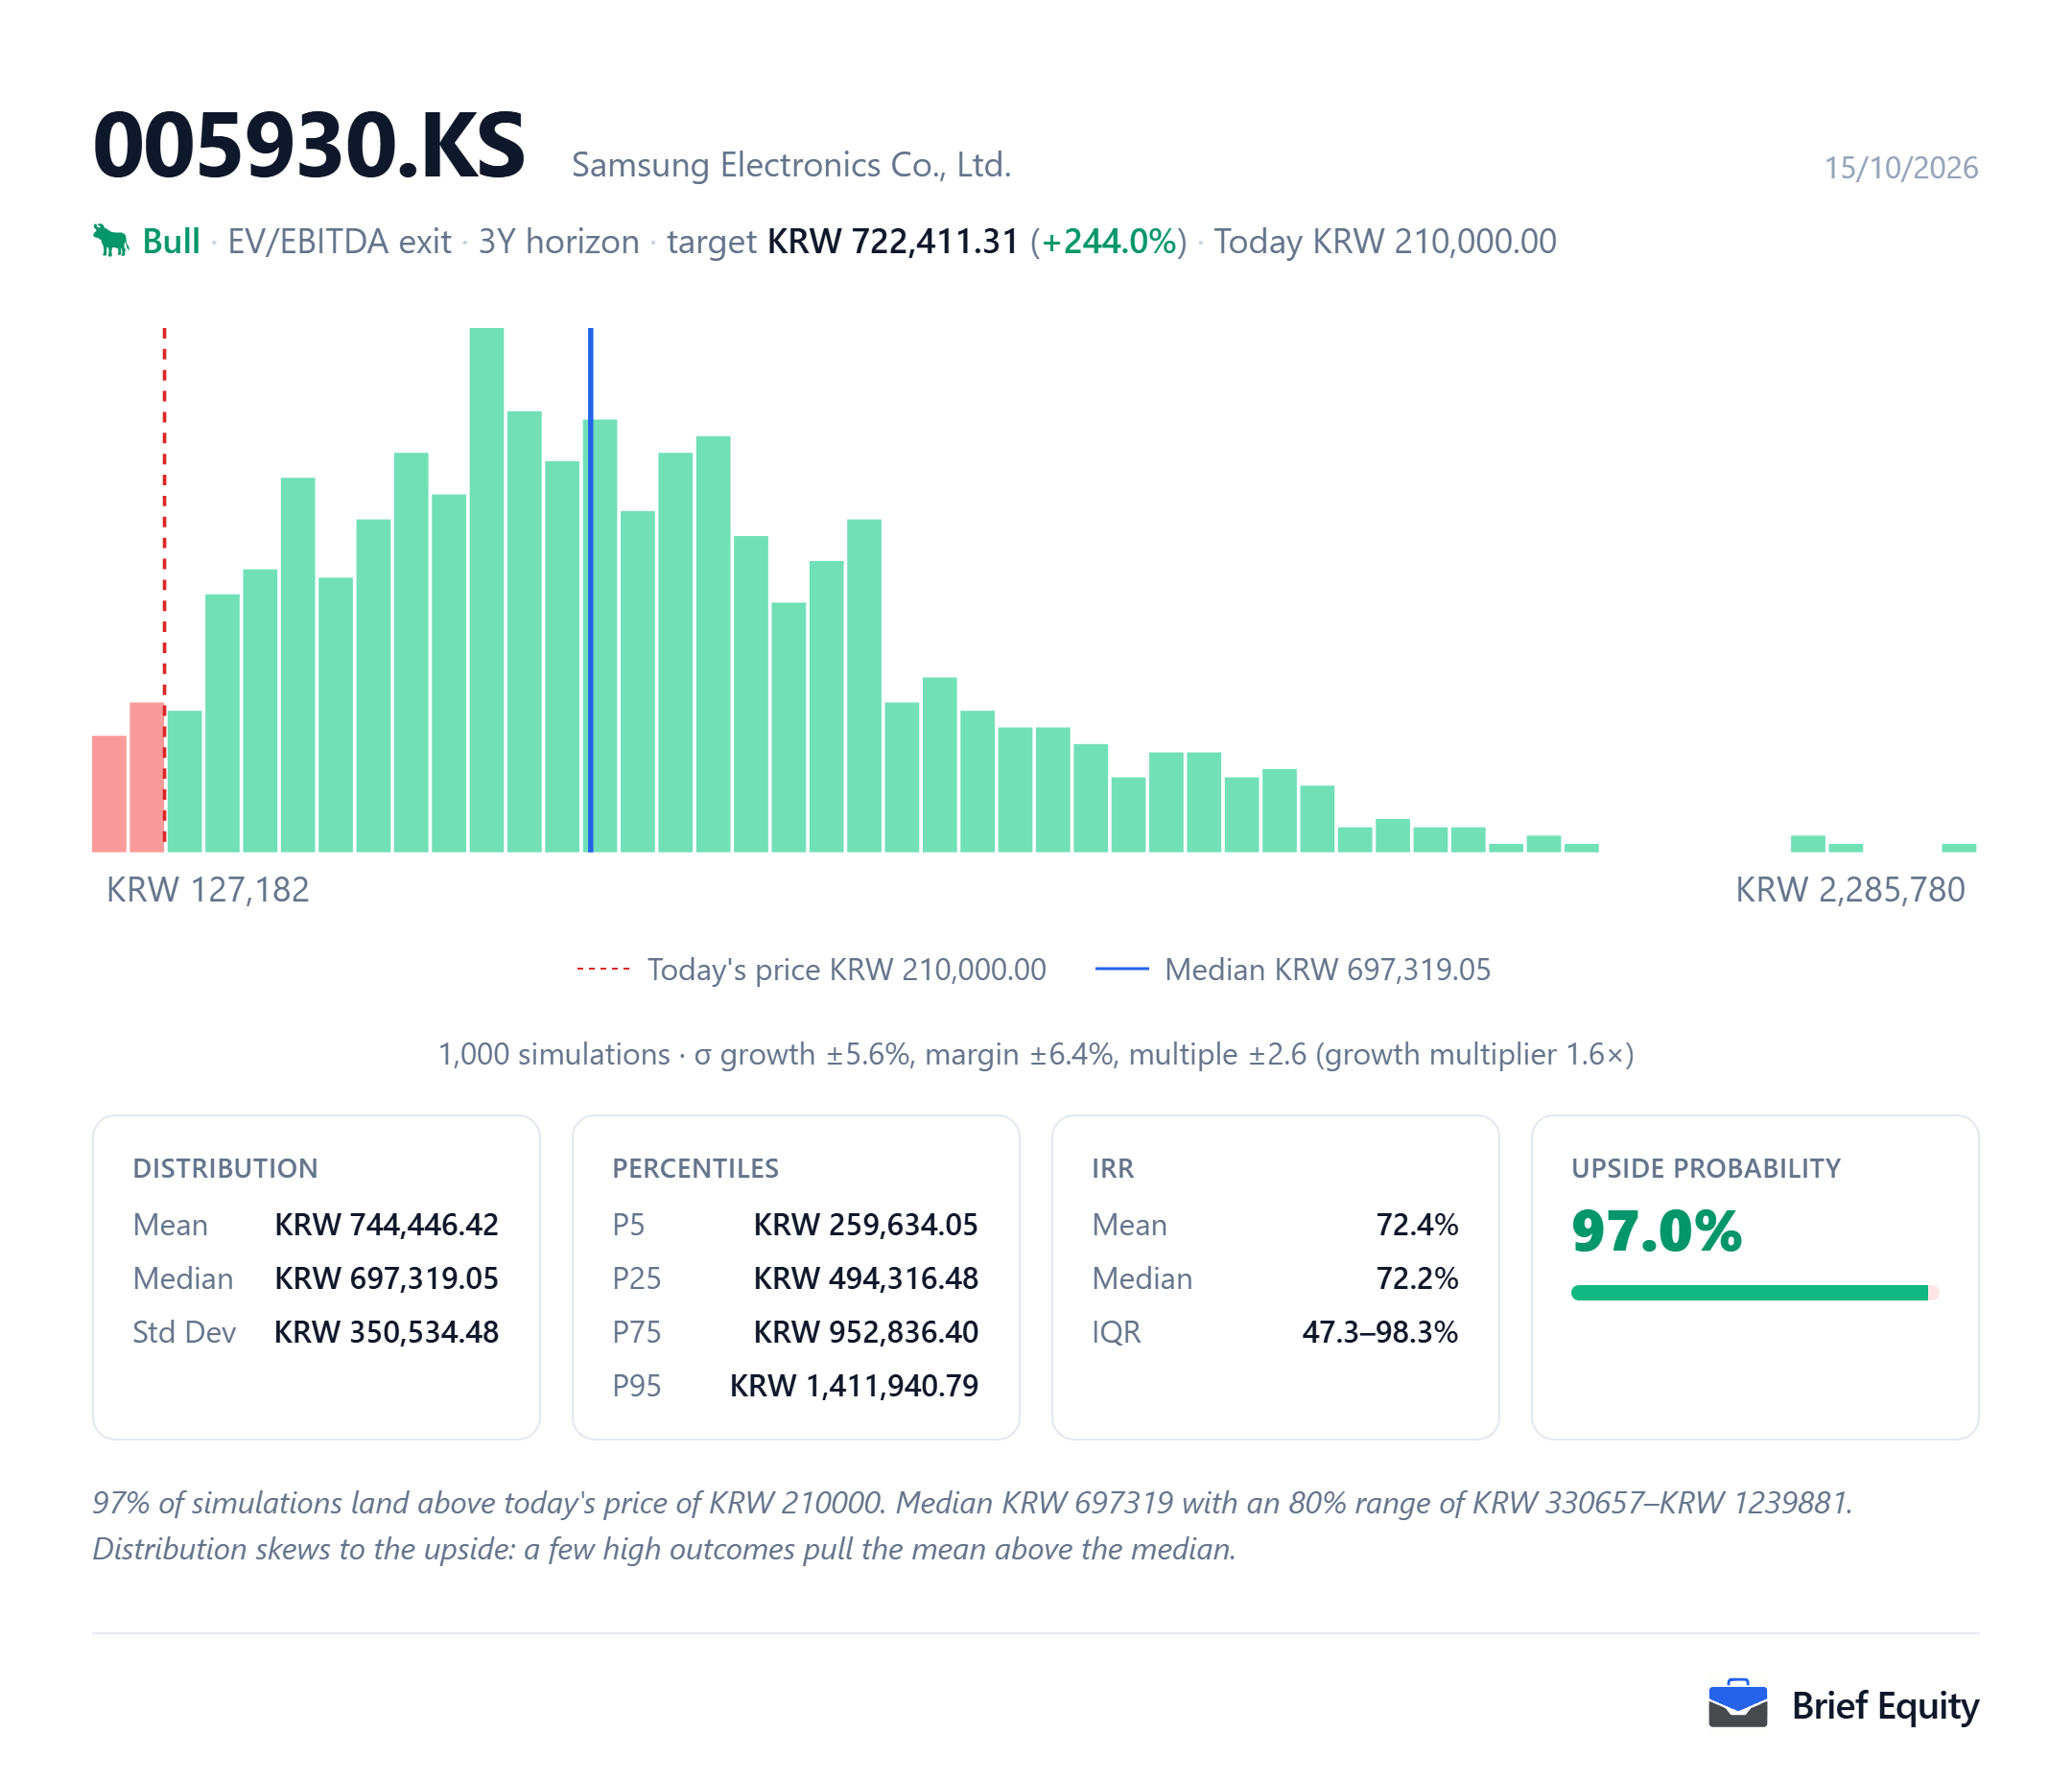
The estimate for Samsung Electronics depends on its assumptions, and the two pictures below show how far it moves when they change. The first varies two assumptions at a time, and the second runs the model many times with growth, margin and the exit multiple drawn at random.
Questions about Samsung Electronics
These questions about Samsung Electronics (005930.KS) are answered from the documents listed under Sources.
- What is the difference between Samsung Electronics' common and preferred shares?
- Samsung's preferred shares carry no voting rights and receive an extra cash dividend of 1% of par value a year compared with its common shares, according to its interim financial statements for the first half of 2026.
- How much does Samsung Electronics depend on its largest customers?
- Samsung's five largest customers accounted for approximately 25% of its sales in the first half of 2026, according to its half-year business report.
- How much did Samsung Electronics spend on capital expenditure in 2025?
- Samsung's capital expenditure in 2025 was approximately KRW 52.7 trillion, concentrated on its chip division (DS) and Samsung Display, according to its 2025 business report.
- Does Samsung Electronics have net cash?
- Samsung reported net cash of KRW 167.59 trillion at June 30, 2026, with cash defined to include short-term financial instruments.
- What shareholder return did Samsung Electronics approve for 2026?
- In August 2026, Samsung's board approved a shareholder return plan for 2026 estimated at approximately KRW 90 trillion to KRW 110 trillion.
- Is Samsung Electronics planning a listing in the United States?
- On its second-quarter 2026 earnings call, Samsung said it is not currently reviewing an ADR issuance.
Sources
The quotations and facts about Samsung Electronics (005930.KS) on this page rest on the documents below.
- Samsung Electronics earnings guidance for the third quarter of 2026, October 8, 2026
- Samsung Electronics second-quarter 2026 earnings call, July 29, 2026
- Samsung Electronics first-quarter 2026 earnings call, April 29, 2026
- Samsung Electronics second-quarter 2026 earnings presentation, July 30, 2026
- Samsung Electronics 2026 half-year business report, June 30, 2026
- Samsung Electronics interim consolidated financial statements, June 30, 2026, August 13, 2026
- Samsung Electronics 2025 business report, December 31, 2025
- Samsung Electronics shareholder return plan for 2026, August 21, 2026
- Daily share prices for Samsung Electronics, October 2025 to October 2026, October 15, 2026
- TrendForce, memory contract price forecast for the fourth quarter of 2026, September 30, 2026
- The Korea Times, CXMT plans a denser server DRAM chip, October 13, 2026
- The Korea Times, CXMT's capacity plans for 2027 and 2028, July 31, 2026
About this page
Brief Equity and its team hold no position in Samsung Electronics (005930.KS) as of October 15, 2026.
This page is research, not investment advice. It describes one model and the assumptions behind it, and market data is delayed. Read how these models are built and our editorial policy.
Related guides: EV/EBITDA explained, What is enterprise value (EV), How to do a comparable-companies (comps) analysis.