Valuation · EV/EBITDA model
Is S&P Global (SPGI) stock undervalued?
Brief Equity's quick EV/EBITDA model of S&P Global, dated October 28, 2026, puts the shares at about $716 for 2028, against a price of $448.93 that day. On those assumptions S&P Global looks cheap, with the model's value about 59% above the price. The view rests on debt issuance and index fees keeping revenue growth close to the company's raised 2026 guidance through 2028.
By The Brief Equity Team · Model dated · Published
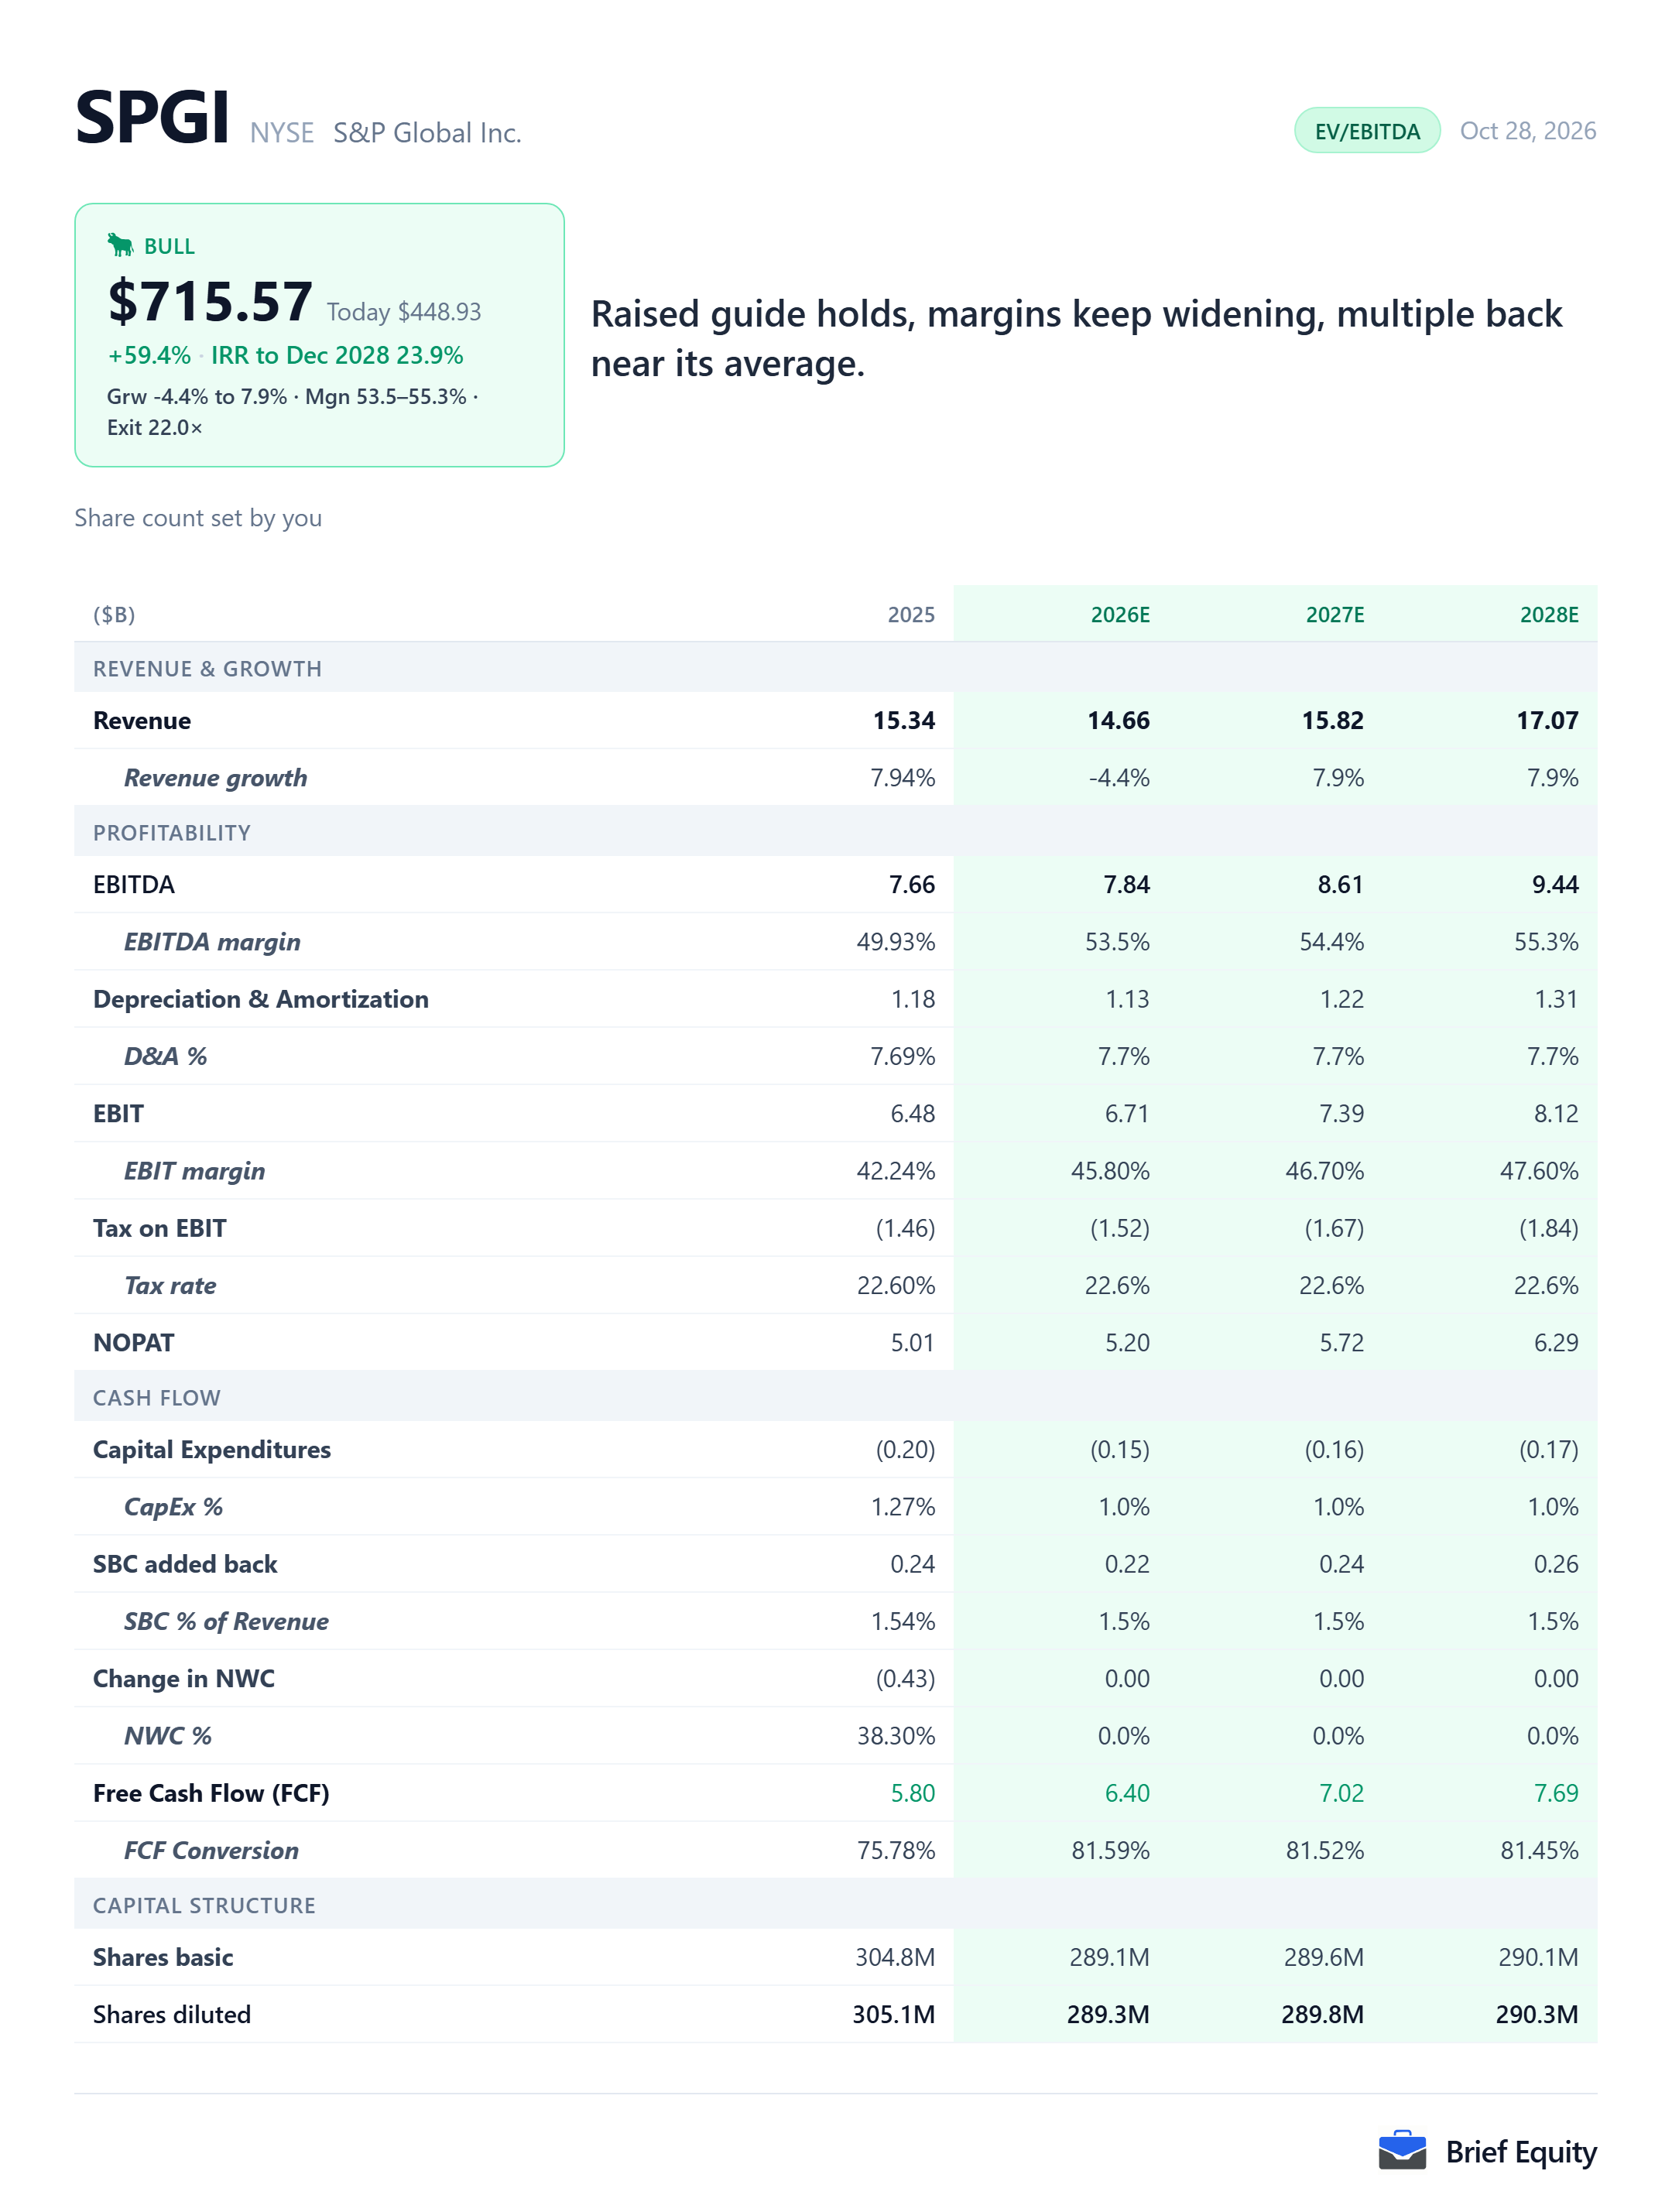
The model's assumptions for S&P Global
S&P Global's fiscal year is the calendar year, so each year in the tables below is the company's own. The model runs three years, to 2028, and the last table sets the model's revenue beside analyst consensus revenue for the same years.
| 2026 | 2027 | 2028 | |
|---|---|---|---|
| Revenue, model | 14.66 | 15.82 | 17.07 |
| EBITDA, model | 7.84 | 8.61 | 9.44 |
| EBITDA margin, model | 53.5% | 54.4% | 55.3% |
| 2027 | 2028 | |
|---|---|---|
| Revenue growth, model | 7.9% | 7.9% |
| 2026 | 2027 | 2028 | |
|---|---|---|---|
| Revenue, model | 14.66 | 15.82 | 17.07 |
| Revenue, analyst consensus | 14.87 | 15.67 | 16.80 |
Why S&P Global looks undervalued
Brief Equity's model of S&P Global suggests the shares look cheap at $448.93, provided debt issuance and index fees keep revenue growing close to the company's raised 2026 guidance through 2028.
S&P Global raised its 2026 guidance for revenue growth to 7.4% to 8.4%, from 5.9% to 7.9%, in its third-quarter release of October 27, 2026. Revenue at its Indices division grew 20% in the third quarter, and the chief executive said the first three quarters of 2026 were the three strongest quarters on record for billed issuance.
On the same day, S&P Global began a strategic review of Capital IQ and associated data businesses, but its guidance counts Market Intelligence as it is structured today, and management said the earliest meaningful update on the review would come on its February earnings call.
“As such, the guidance provided assumes a full contribution from Market Intelligence, as it is currently structured, for the full year.”
S&P Global third-quarter 2026 results release, October 27, 2026
S&P Global's shares opened at $470.00 on October 27, 2026, the day of the results, and closed that day at $448.93, below the previous day's close. On Brief Equity's Charts tab on October 28, 2026, S&P Global's enterprise value stood at 17.1 times trailing EBITDA against an average of 22.7 times since October 2017, and its share price at 26.6 times trailing earnings against an average of 36.0 times.
In the model, S&P Global's revenue grows 7.9% in 2027 and 7.9% in 2028, to $17.07 billion in 2028 against analyst consensus revenue of $16.80 billion for that year, and its EBITDA margin widens from 53.5% in 2026 to 55.3% in 2028. At 22 times 2028 EBITDA, a little below the average since October 2017, the shares come to about $716 in 2028, about 59% above the price.
S&P Global's Ratings and Indices divisions accounted for 38.1% and 26.4% of the company's revenue growth over the first nine months of 2026, and both depend on markets. Billed issuance rose 8% in the third quarter but only by low single digits without the large cloud companies, Ratings revenue grew 2% in the quarter, and the asset-linked fees in Indices grew 24% on market appreciation as well as net inflows.
What has to be true, and what would break it
S&P Global looks cheap on this model only while a few things hold, and the view fails if they stop holding.
What has to be true
- Debt issuance stays strong after the large cloud companies' borrowing of 2026, so Ratings keeps growing.
- Equity markets and fund inflows keep lifting the asset-linked fees in Indices.
- S&P Global's revenue keeps growing close to its raised 2026 guidance in 2027 and 2028.
- S&P Global's valuation moves back toward its average since October 2017.
What would break it
- Issuance slows once the large cloud companies borrow less: without their borrowing, billed issuance grew only by low single digits in the third quarter of 2026.
- A market decline cuts the asset-linked fees that drove Indices' growth in 2026.
- The valuation stays near its level of October 2026 instead of returning toward its average.
The parts of S&P Global's business
S&P Global reports four divisions after the July 2026 spin-off of Mobility, and the shares below cover the first nine months of 2026.
| Share of revenue | Share of revenue growth | |
|---|---|---|
| Ratings | 34.1% | 38.1% |
| Market Intelligence | 33.5% | 25.4% |
| Energy | 18.0% | 10.0% |
| Indices | 14.4% | 26.4% |
S&P Global beside its peers
S&P Global is compared here with nine US-listed companies chosen to cover its ratings, index and data businesses.
- MCO: Credit ratings, against S&P Global's Ratings division
- FICO: A credit benchmark tied to lending volume, beside Ratings
- MSCI: Indices, against S&P Dow Jones Indices
- NDAQ: Indices and exchange data
- CME: The derivatives side of the index business
- FDS: Financial data and workflow, against Market Intelligence and Capital IQ
- MORN: Data and research, against Market Intelligence
- VRSK: Data sold by subscription
- ICE: Market data and exchanges
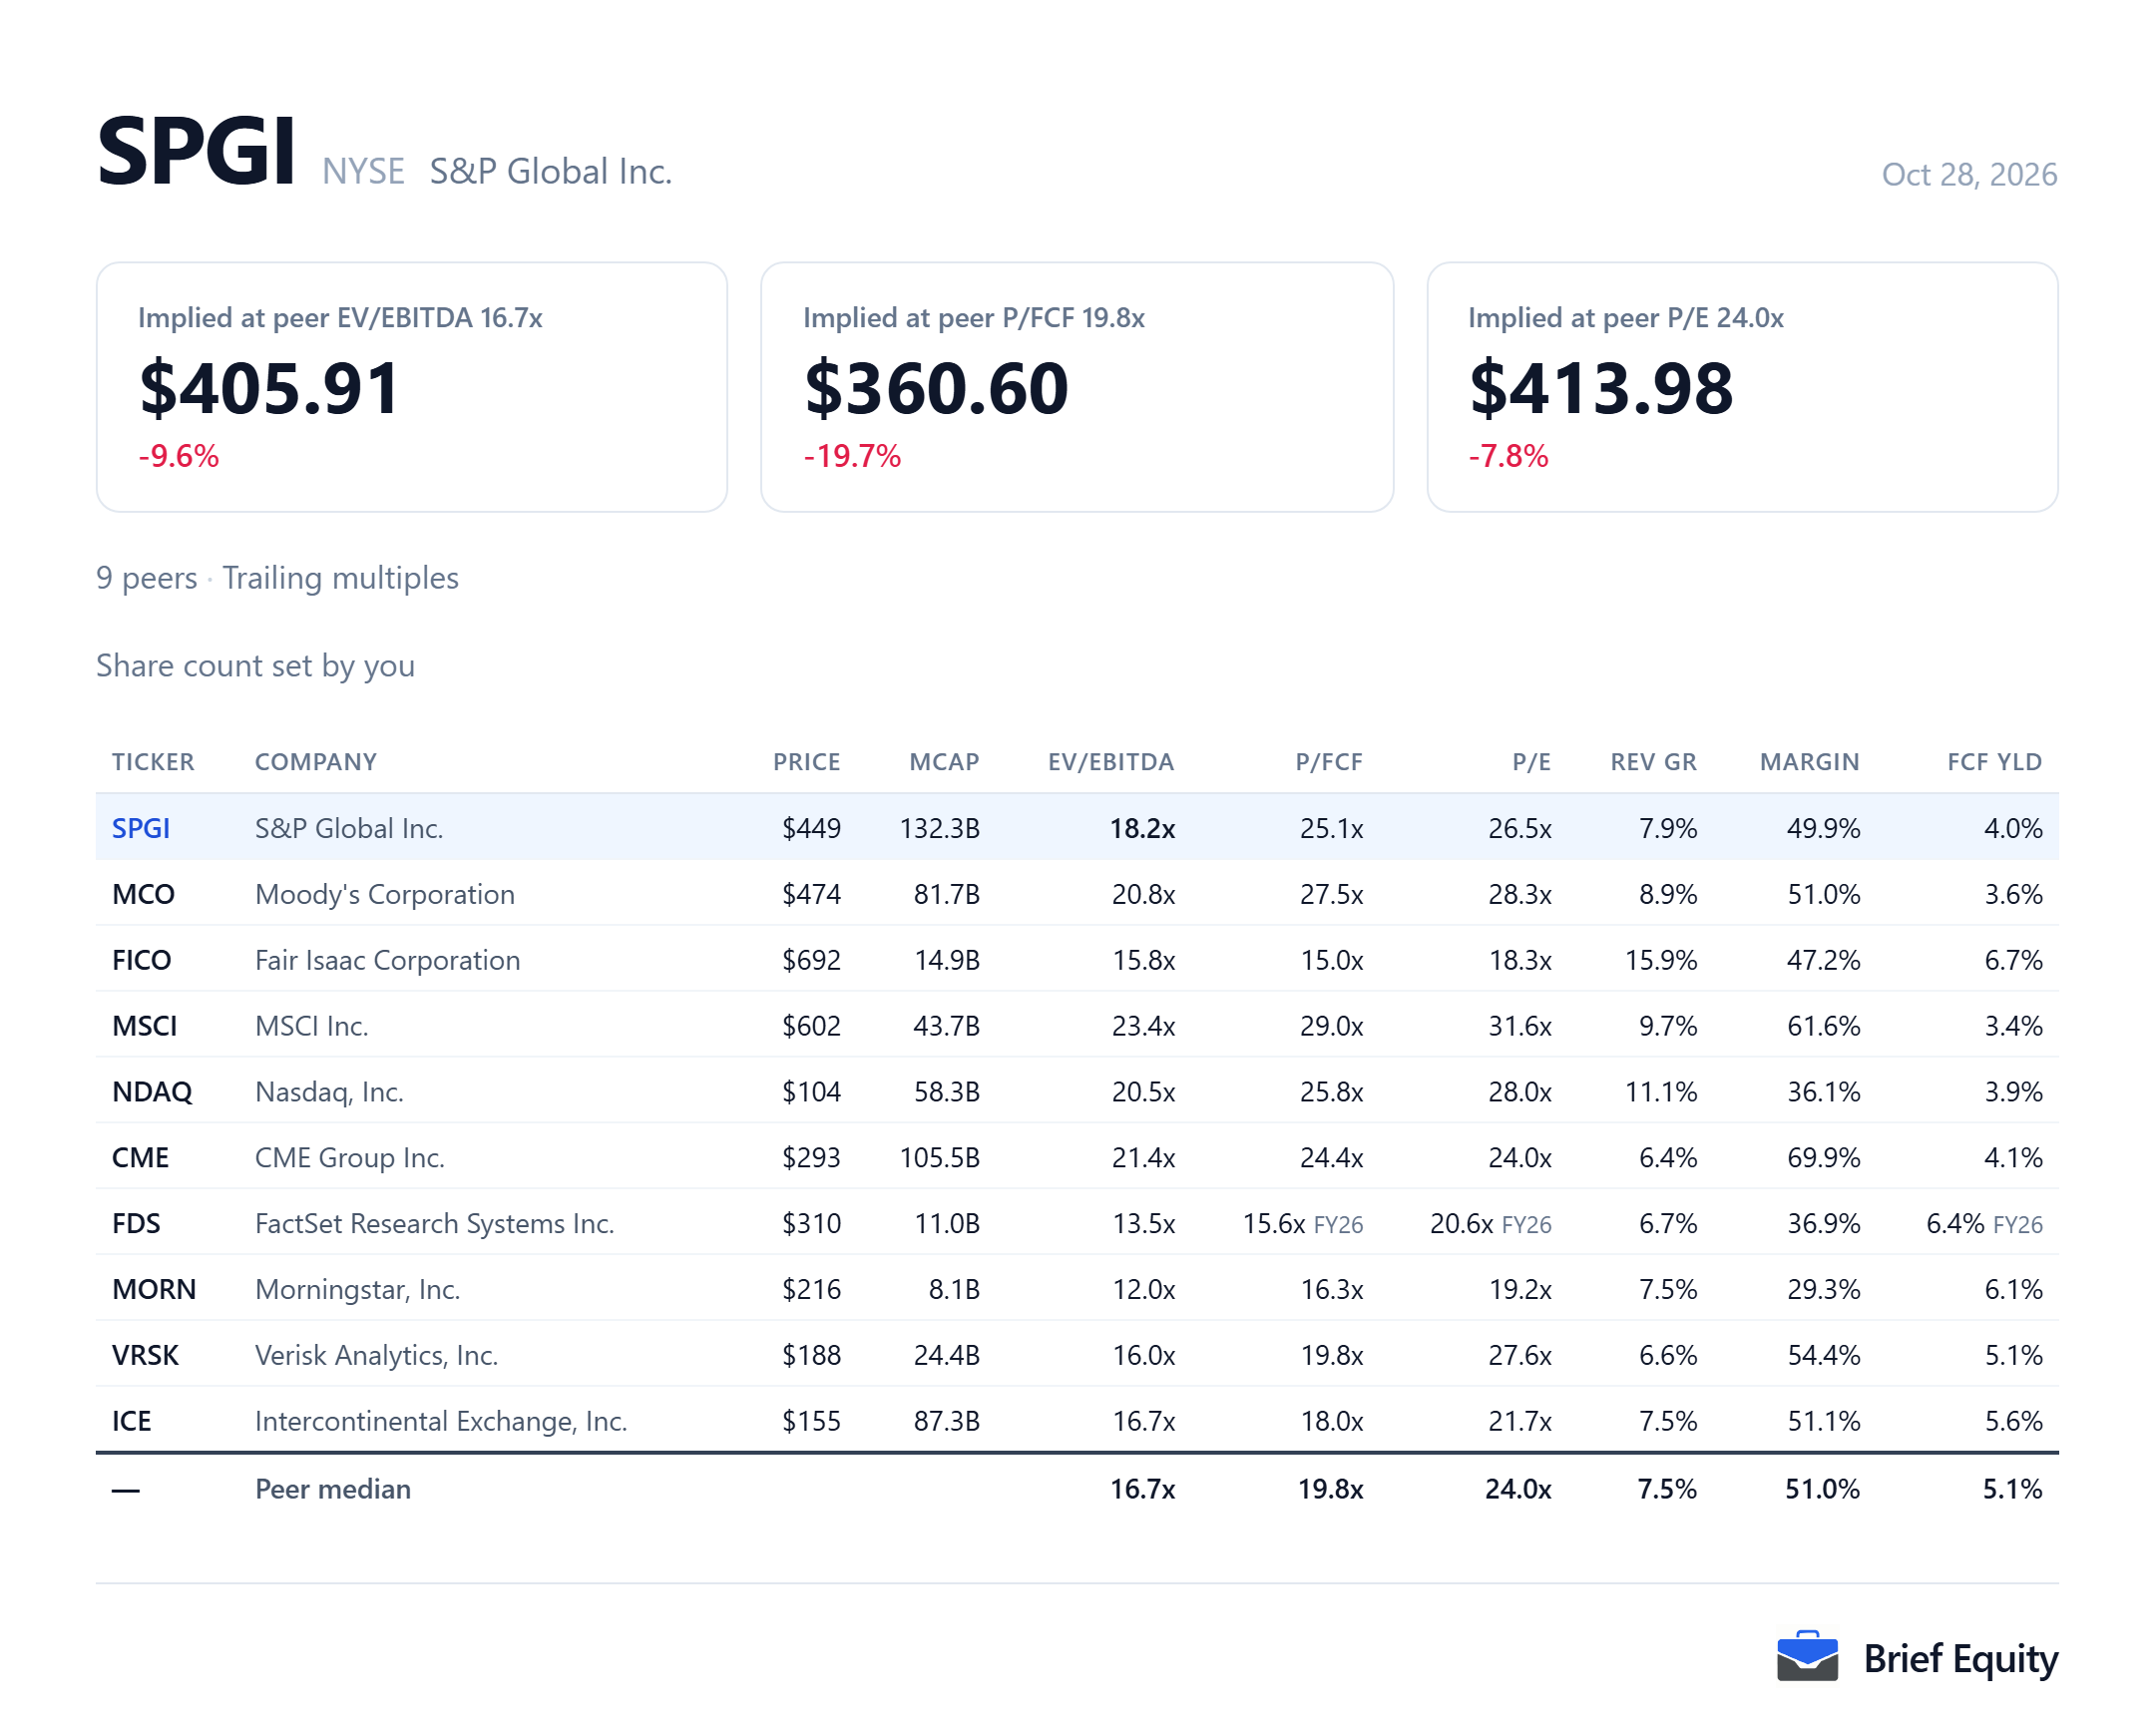
How the estimate moves with its assumptions
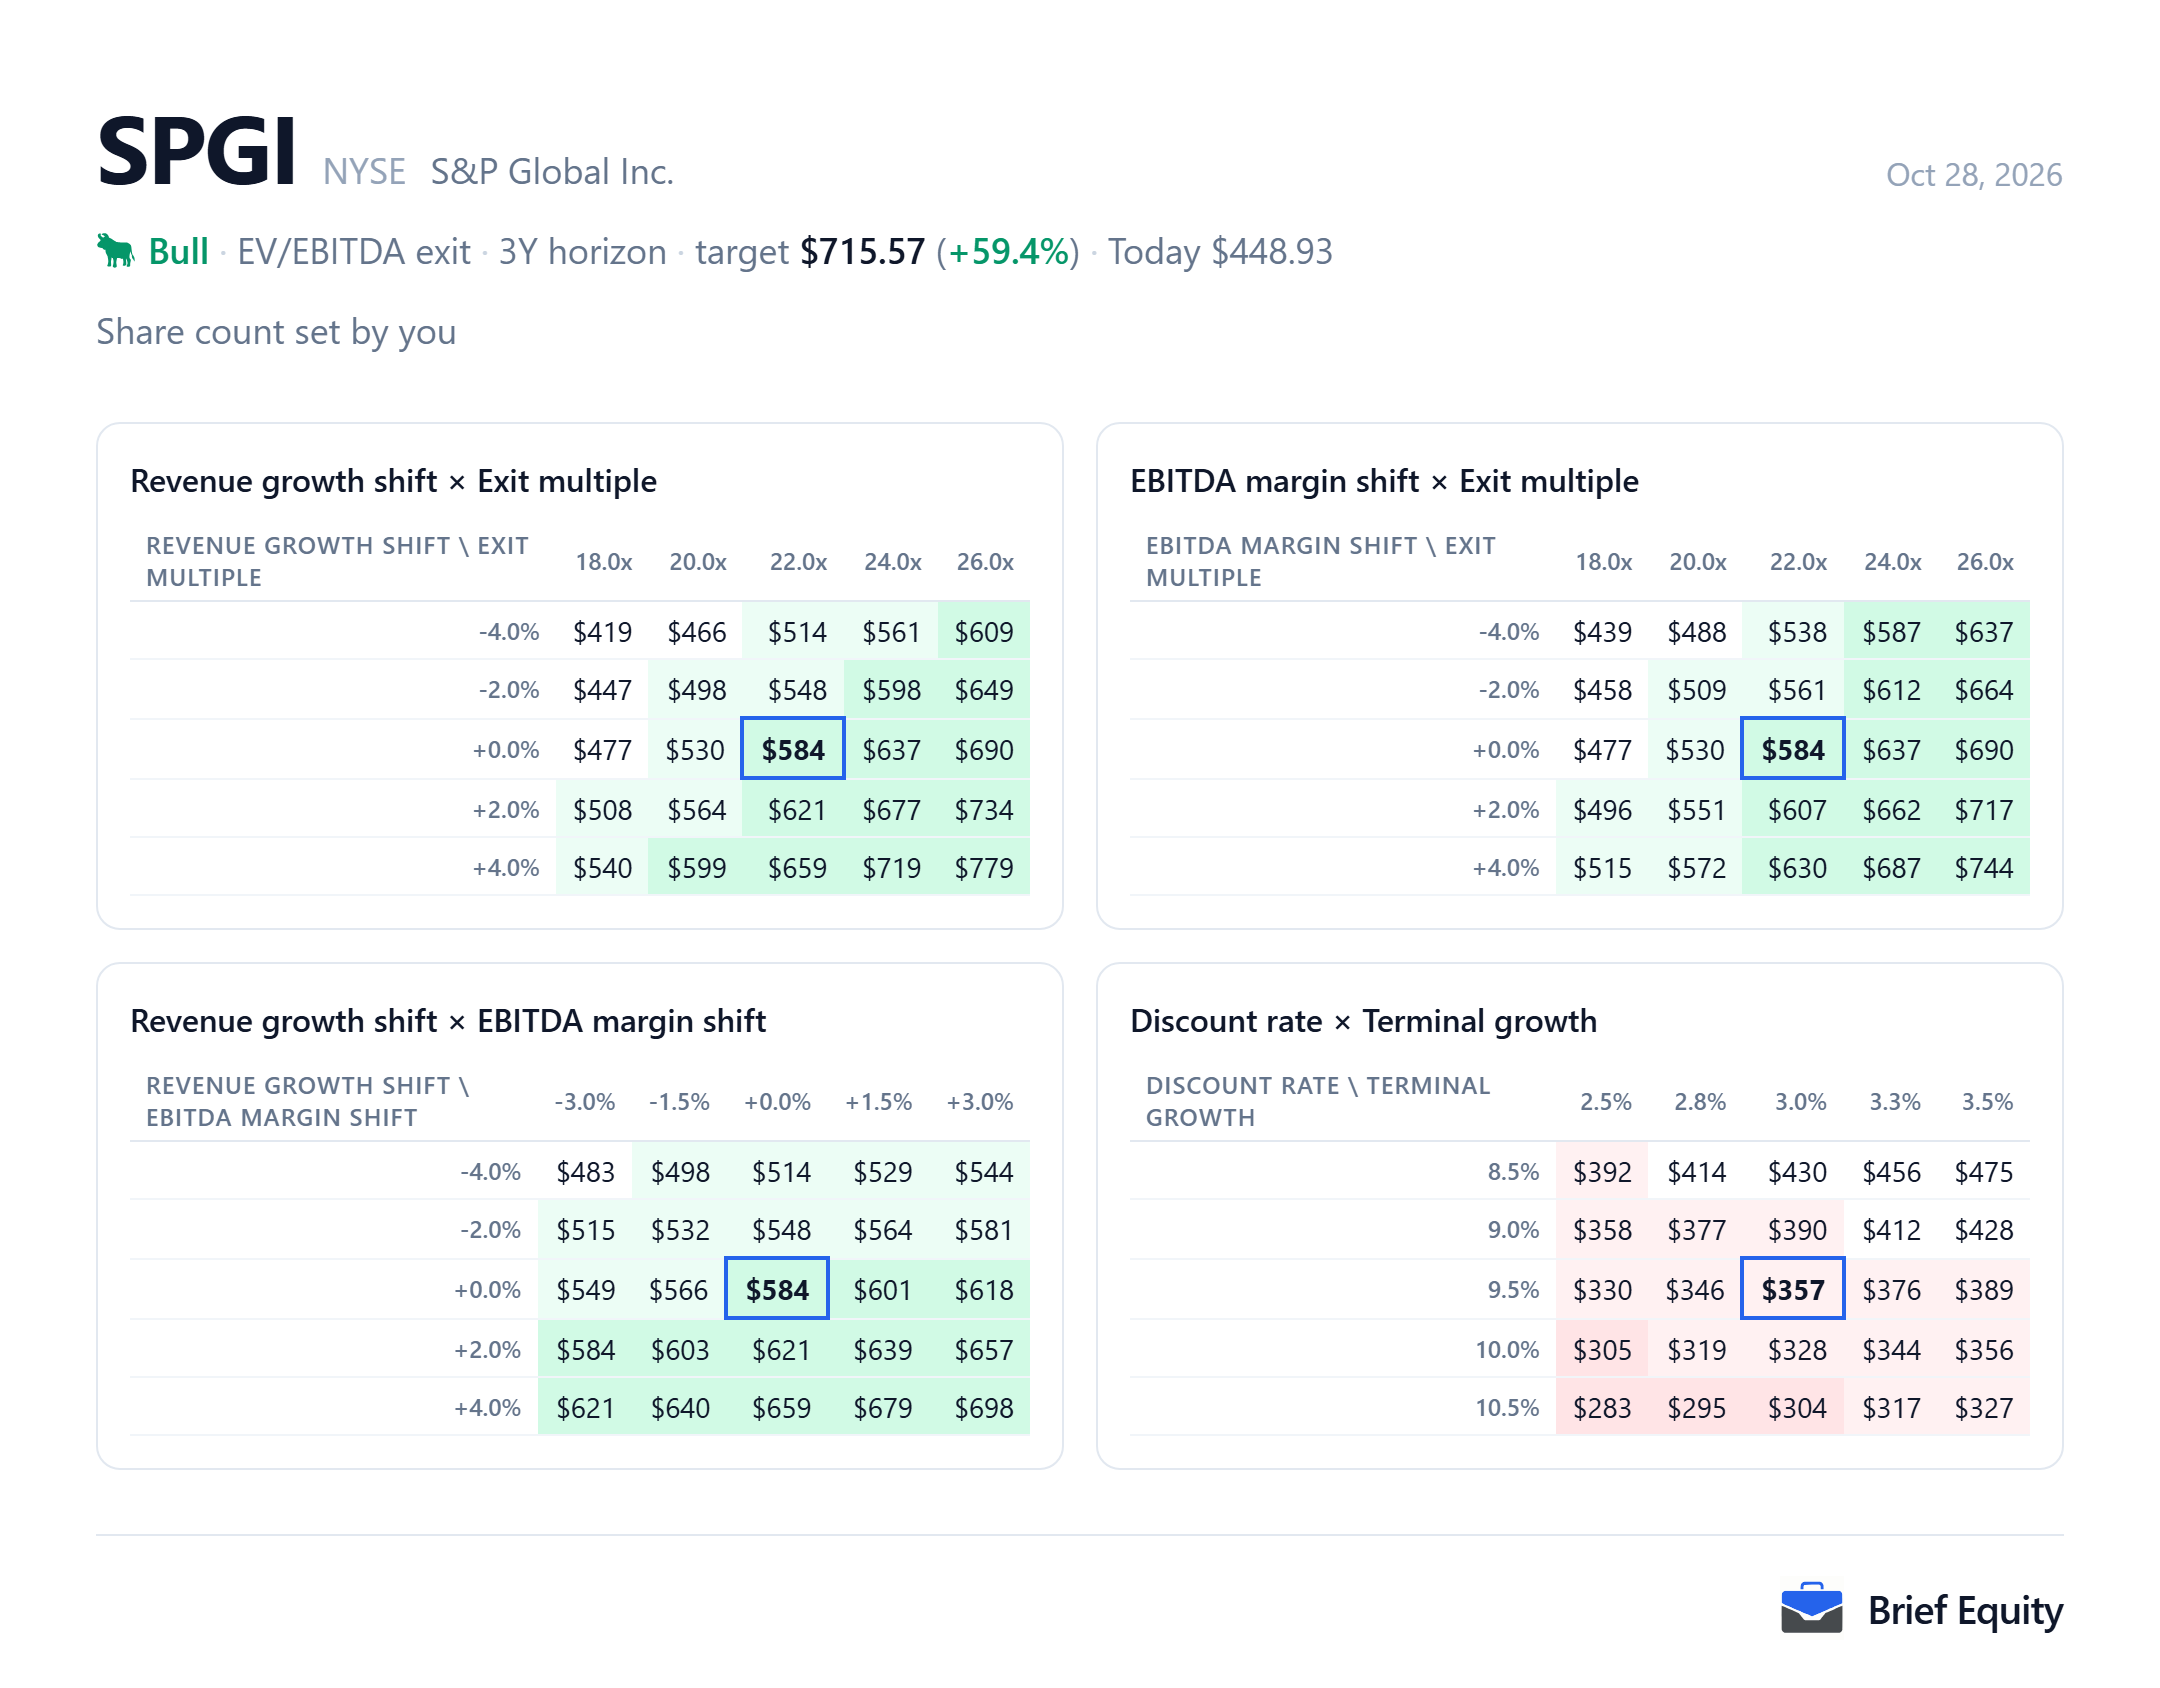
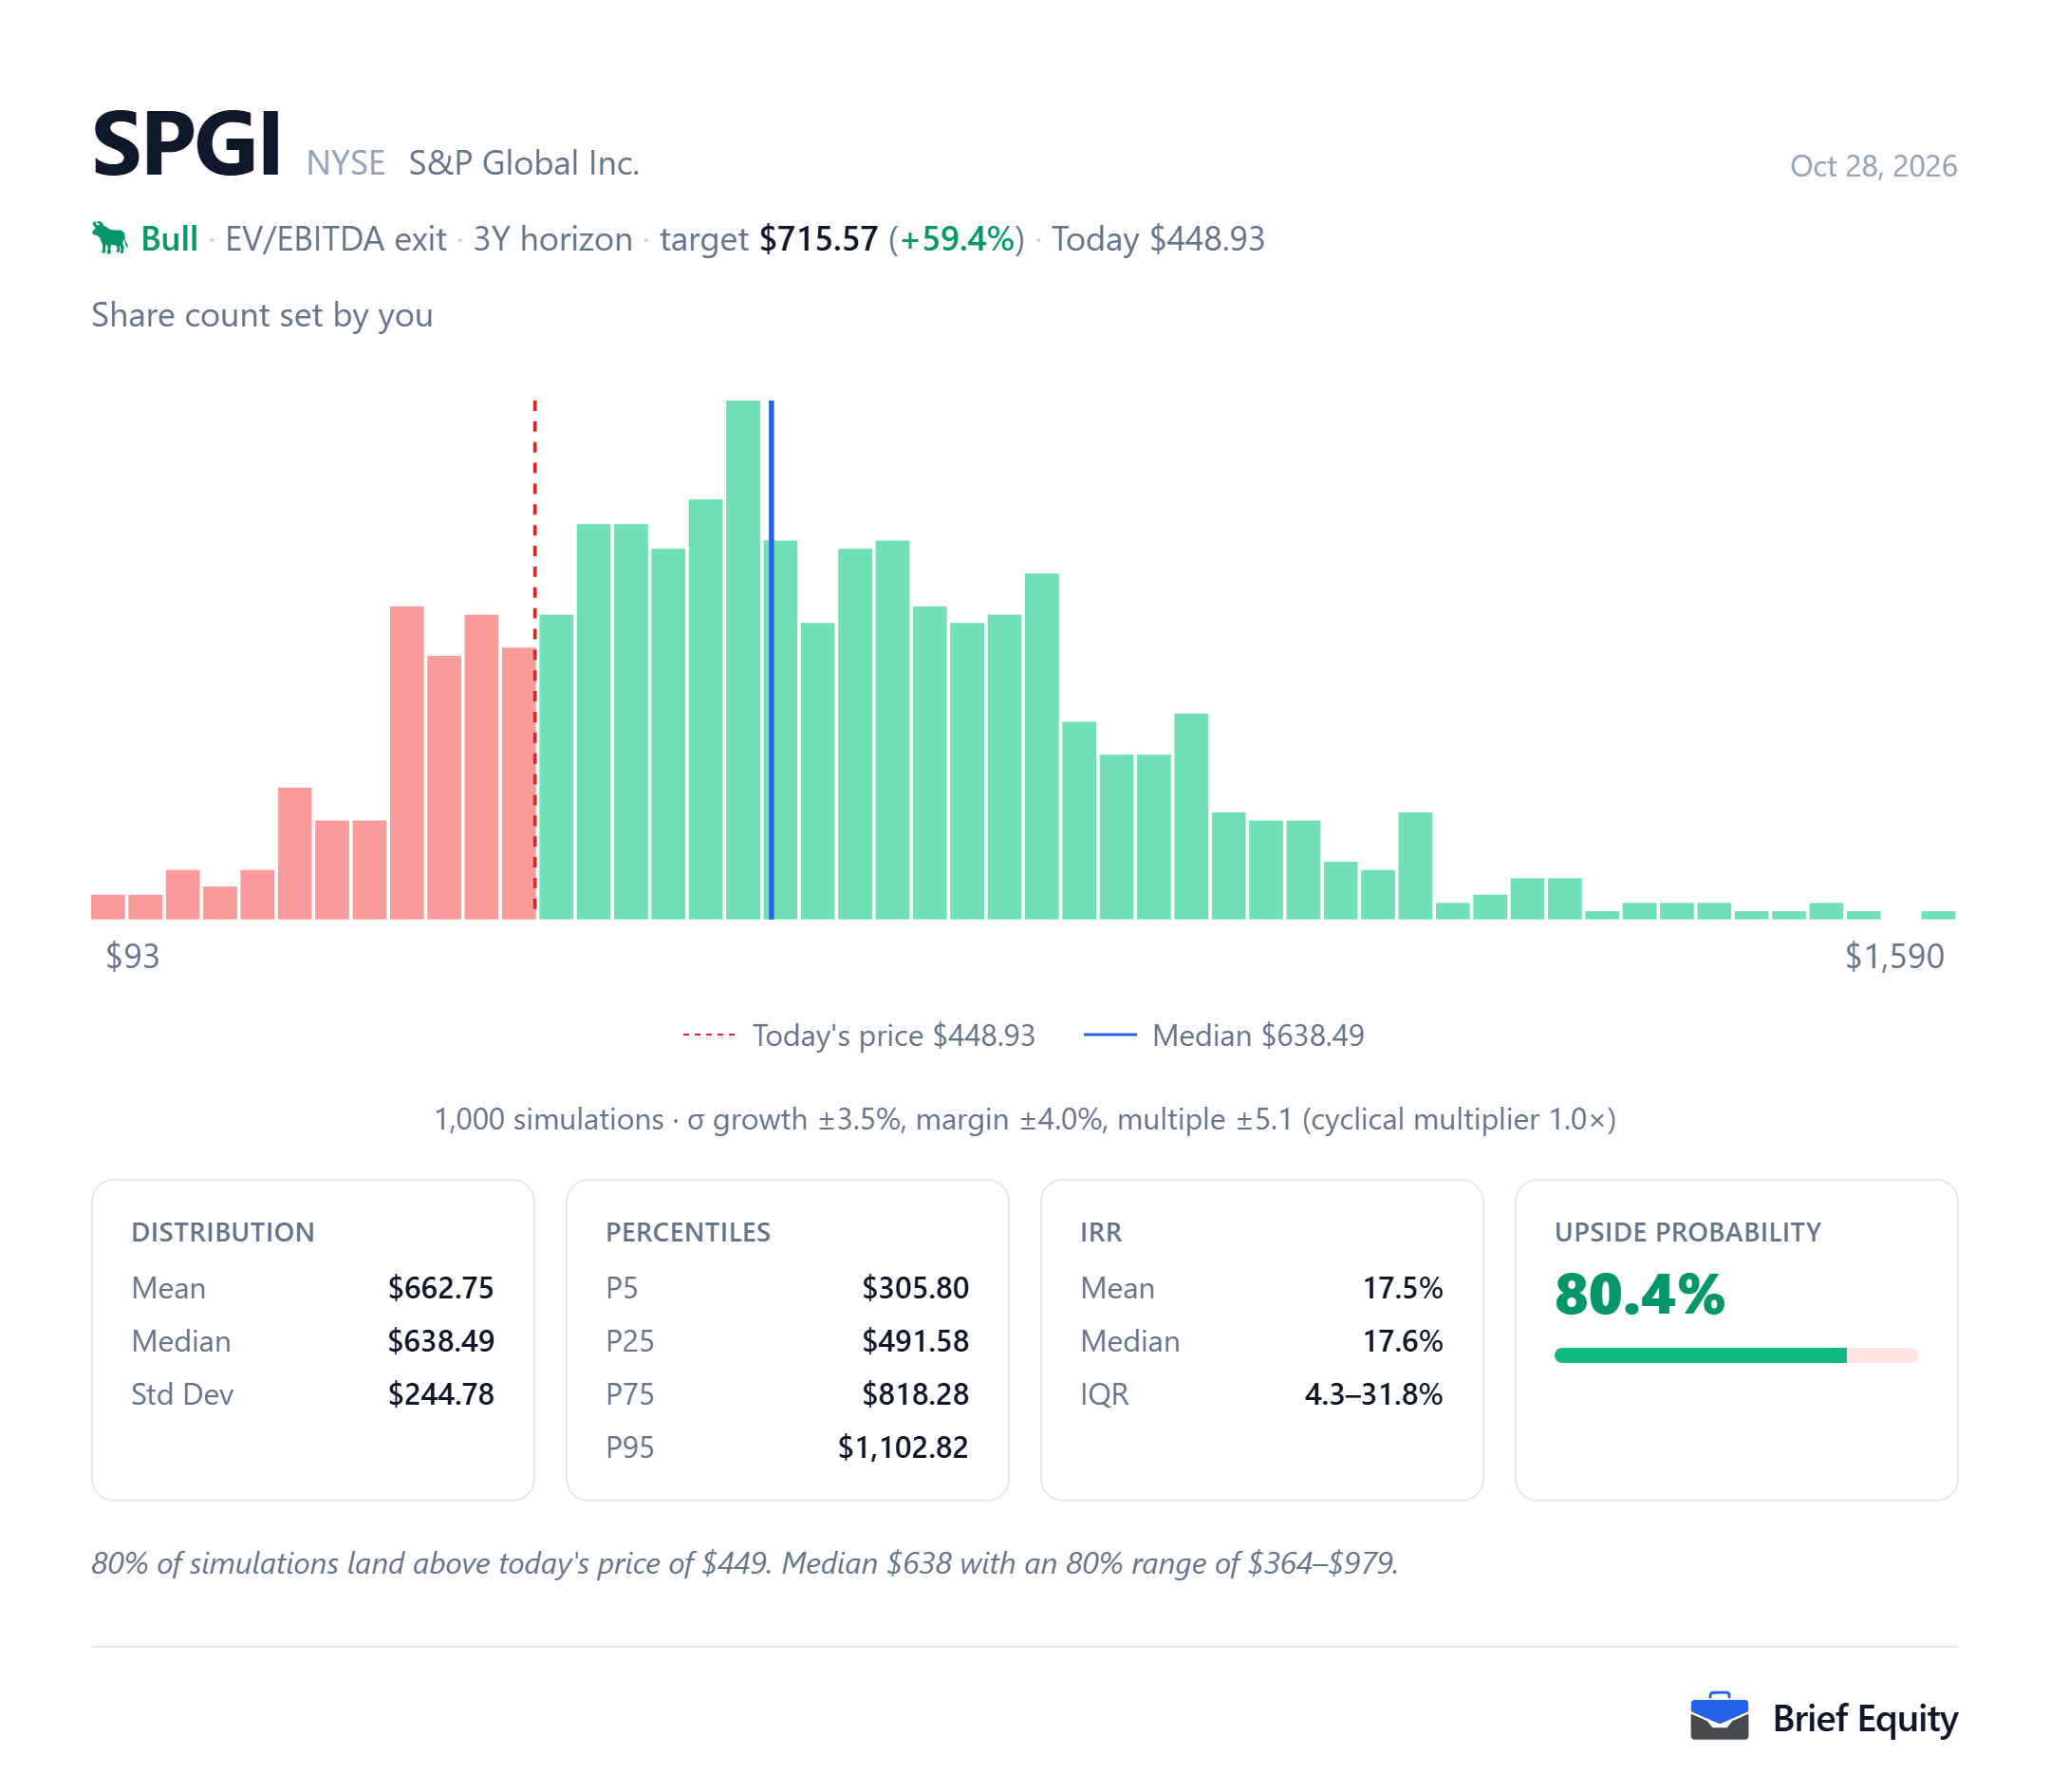
The two pictures below show how far the S&P Global estimate moves when its assumptions change: one moves two assumptions at a time, and the other runs the model many times with growth, margin and the exit multiple drawn at random.
Questions about S&P Global
These questions about S&P Global (SPGI) are answered from the documents listed under Sources.
- What is in S&P Global's strategic review?
- On October 27, 2026, S&P Global began a strategic review of alternatives, including a potential separation, for Capital IQ and associated data businesses, which make up the majority of Kensho Data & Platforms within Market Intelligence. It expects to keep RatingsDirect, RatingsXpress and Enterprise Solutions.
- When did S&P Global spin off Mobility?
- S&P Global completed the spin-off of its Mobility division as Mobility Global (NYSE: MBGL) on July 1, 2026. From its third-quarter 2026 statements, Mobility is reported as discontinued operations.
- What did S&P Global guide for 2026 earnings per share?
- In its release of October 27, 2026, S&P Global guided 2026 diluted earnings per share of $16.25 to $16.50, and $17.70 to $17.95 on an adjusted basis.
- How much stock is S&P Global buying back in 2026?
- S&P Global repurchased $2.6 billion of shares in the third quarter of 2026 and more than $4 billion so far that year. It expects to repurchase more than $7 billion in total in 2026.
- How much debt does S&P Global have?
- At September 30, 2026, S&P Global's total debt was $13,062 million and its cash and cash equivalents were $2,441 million.
- Does S&P Global pay a dividend?
- In its release of October 27, 2026, S&P Global said its board had authorized a quarterly cash dividend of $0.97 per share.
Sources
The quotations and facts about S&P Global (SPGI) on this page rest on the documents below.
- S&P Global third-quarter 2026 results release, October 27, 2026
- S&P Global quarterly report (Form 10-Q) for the third quarter of 2026, October 28, 2026
- S&P Global third-quarter 2026 earnings call, October 27, 2026
- S&P Global EV/EBITDA and P/E since October 2017, Brief Equity Charts tab, October 28, 2026
- S&P Global shares before the open on October 27, 2026, October 27, 2026
- S&P Global share price on October 27, 2026, October 27, 2026
- S&P Global previous close, October 27, 2026, October 28, 2026
About this page
Brief Equity and its team hold no position in S&P Global (SPGI) as of October 28, 2026.
This page is research, not investment advice. It describes one model and the assumptions behind it, and market data is delayed. Read how these models are built and our editorial policy.
Related guides: EV/EBITDA explained, What is the P/E ratio, How to do a comparable-companies (comps) analysis.