Valuation · EV/EBITDA model
Is Roper Technologies (ROP) stock undervalued?
Brief Equity's quick EV/EBITDA model of Roper Technologies, dated October 24, 2026, values the shares at about $544 for 2028, against a price of $438.14 that day. On those assumptions Roper looks cheap, especially for a business of its quality, with a return of about 24%. The view depends on one condition: that customers buy Roper's new AI tools on top of the software they use now, rather than building their own.
By The Brief Equity Team · Model dated · Published
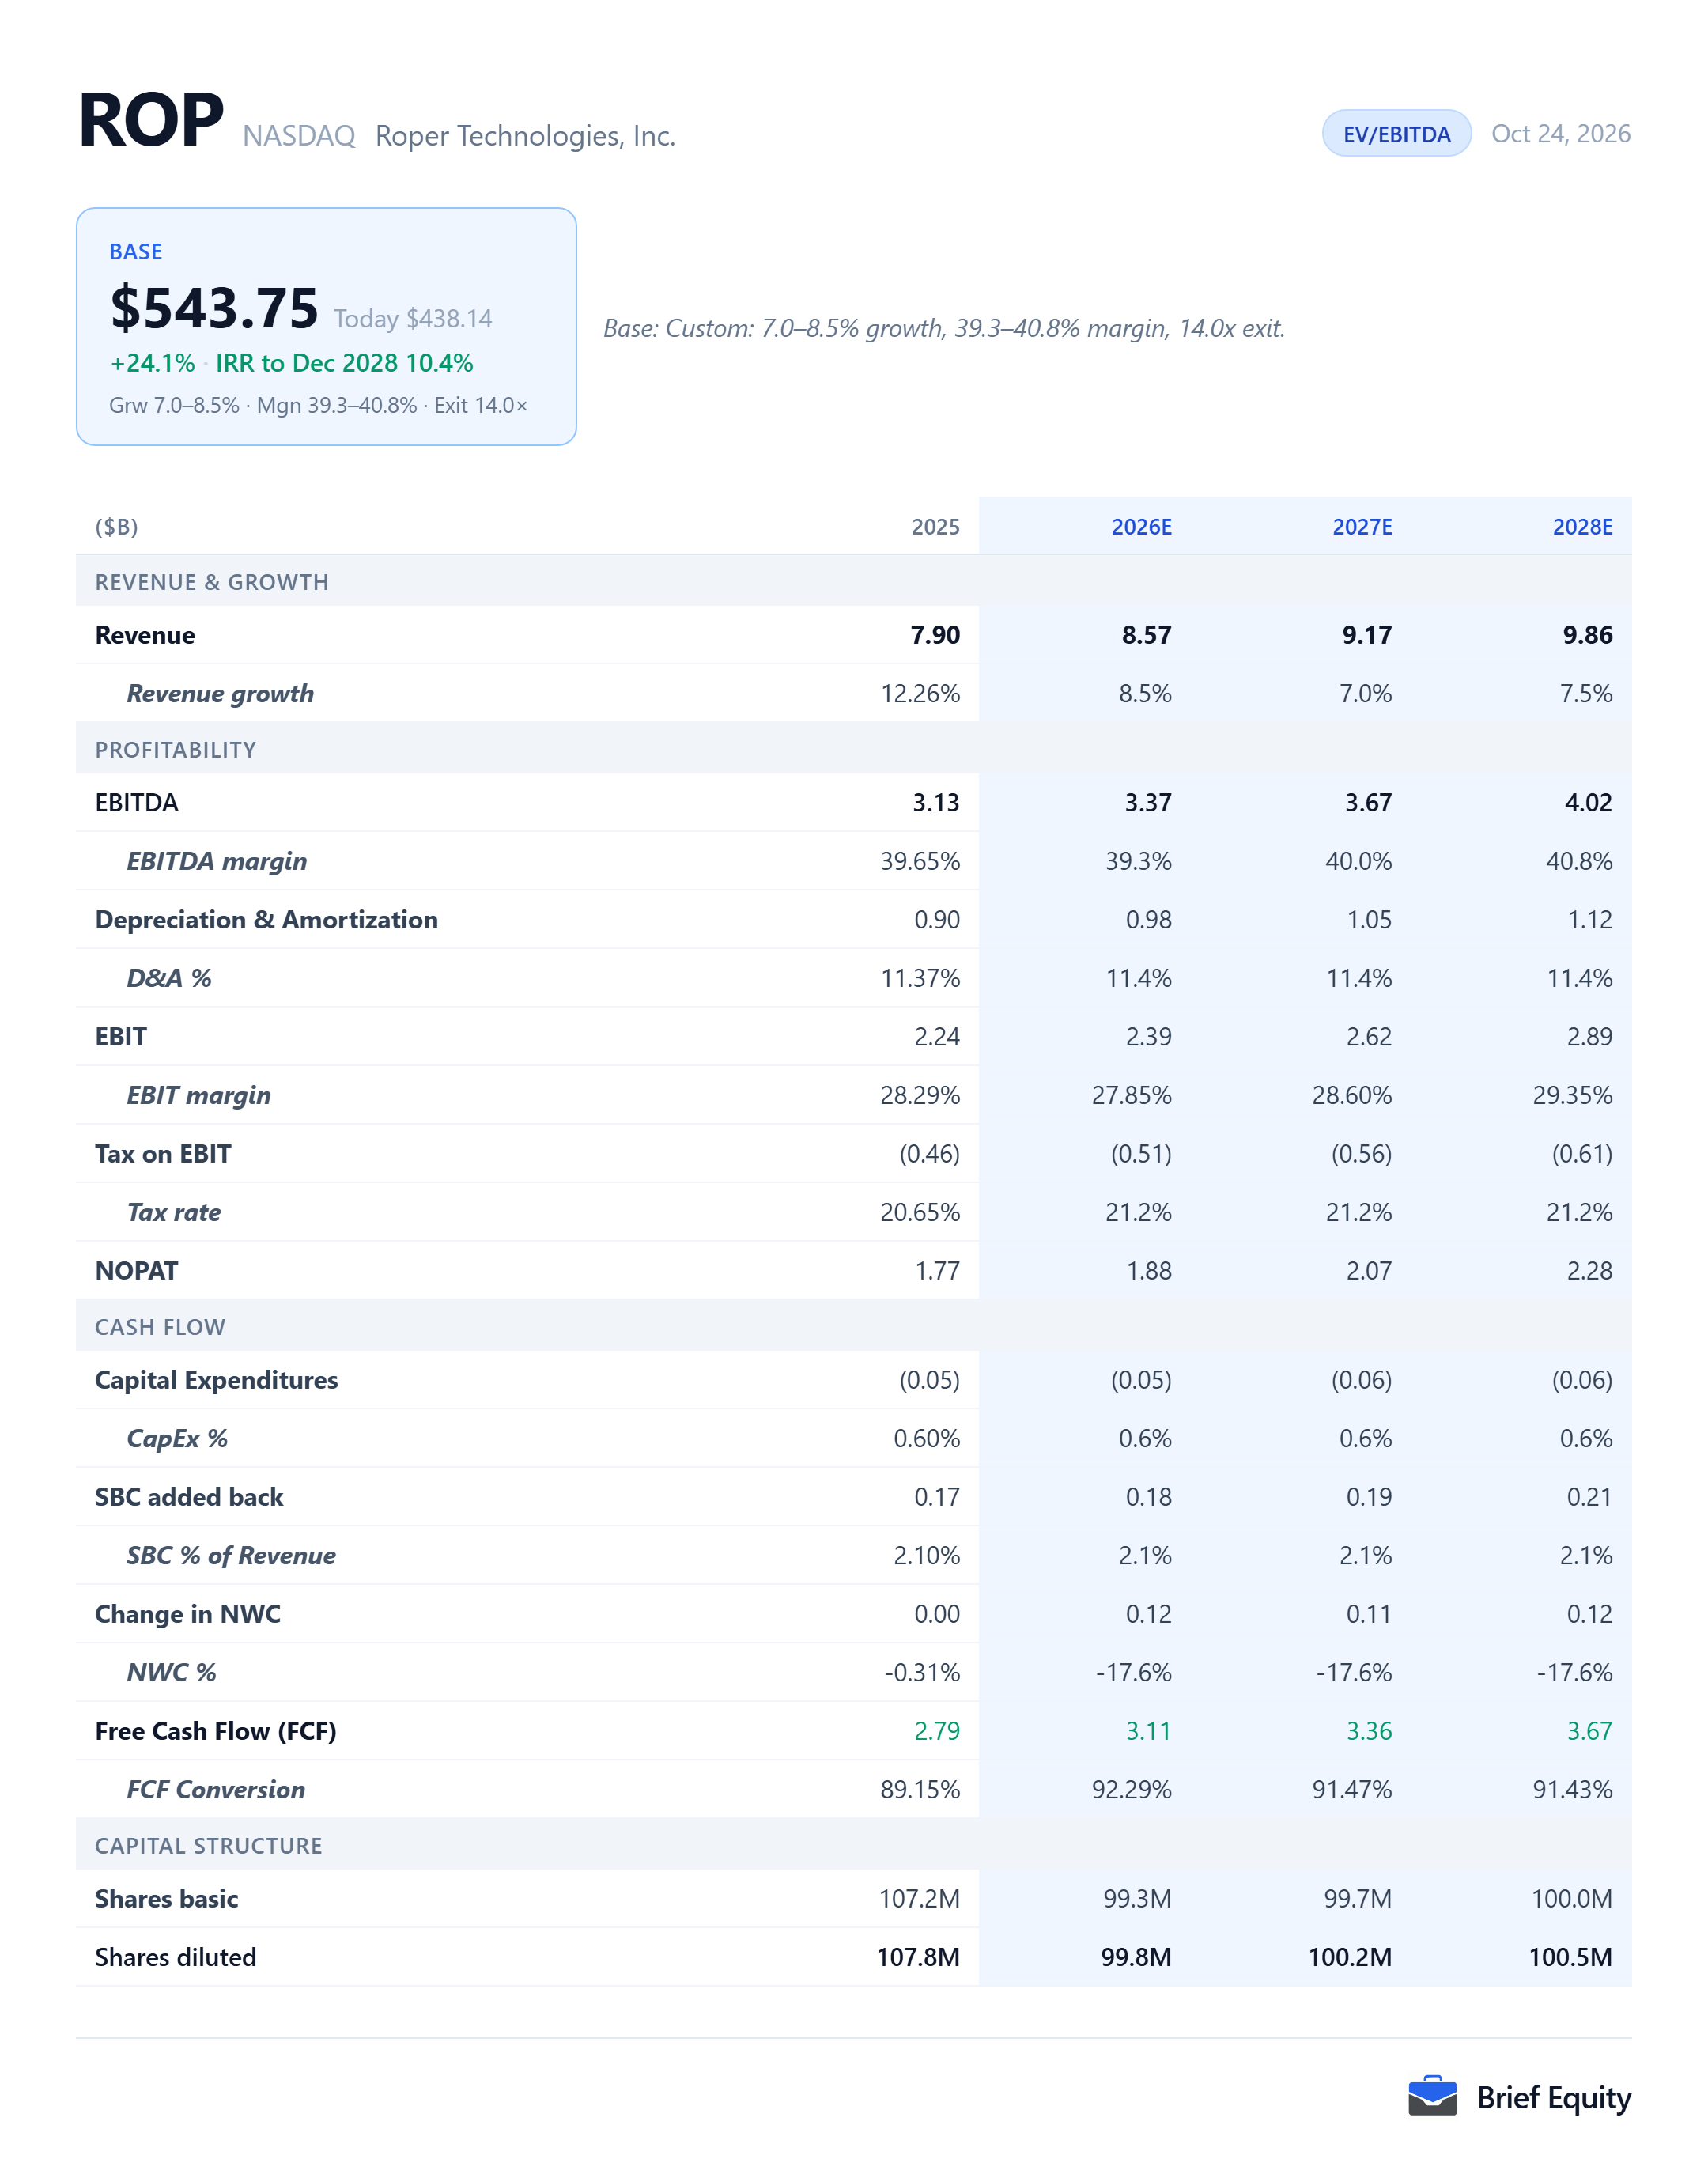
The model's assumptions for Roper Technologies
Roper Technologies' fiscal year is the calendar year. The figures below come from a quick model of Roper, built on a few stated assumptions and projected to 2028, with analyst consensus revenue beside the model's revenue for the same three years.
| 2026 | 2027 | 2028 | |
|---|---|---|---|
| Revenue, model | 8.57 | 9.17 | 9.86 |
| Revenue growth, model | 8.5% | 7.0% | 7.5% |
| EBITDA, model | 3.37 | 3.67 | 4.02 |
| EBITDA margin, model | 39.3% | 40.0% | 40.8% |
| 2026 | 2027 | 2028 | |
|---|---|---|---|
| Revenue, model | 8.57 | 9.17 | 9.86 |
| Revenue, analyst consensus | 8.57 | 9.09 | 9.61 |
Why Roper Technologies looks undervalued
Roper Technologies looks cheap at a share price in the 430s, especially for a business of its quality, even after its shares rose almost 10% in a single session on its third-quarter 2026 results.
Roper's share price decline began after its fourth-quarter 2025 call on January 27, 2026, when its guidance for 2026 came in below analysts' estimates, at the same time as a broad sell-off in software stocks began. The shares recovered to $429.60 on September 3, 2026, then fell to $347.45 by September 29.
Roper owns 29 businesses, most of them in software, and 18 of its 21 software businesses operate in regulated markets. Gross retention in its enterprise software is consistently in the mid-90s, organic recurring revenue in its two software segments grew 8% in the third quarter of 2026, and the company expects free cash flow of 30% or more of revenue for 2026.
Brief Equity's model of Roper is a quick one. It has revenue growing 8.5% in 2026, in line with the company's guidance of total growth above 8%, then 7.0% in 2027 and 7.5% in 2028, against analysts' expected growth of 6.7% a year from 2025 to 2028. With the EBITDA margin rising from 39.3% to 40.8%, valuing the company at 14 times EBITDA in 2028 gives about $544 a share, about 24% above the price on the model's date.
Roper's price of $438.14 implies revenue falling 4.6% a year when the model's other assumptions are held constant.
The model's growth above the consensus in 2027 and 2028 rests on Roper's AI tools, which management aims to sell in addition to the software customers already pay for, rather than in its place. The chief executive said on the third-quarter 2026 call that about 75% of CentralReach's bookings and about 25% of Aderant's are AI or AI-related.
Roper's case therefore depends on its customers buying the AI tools on top of its existing software instead of building their own.
What has to be true, and what would break it
Roper Technologies looks cheap on this model only while a few things hold, and the view fails if they do not.
What has to be true
- Roper's customers buy its AI tools in addition to the software they already use.
- Revenue grows 7.0% to 8.5% a year through 2028.
- The EBITDA margin rises from 39.3% in 2026 to 40.8% in 2028.
- Investors pay at least 14 times EBITDA for the company in 2028.
What would break it
- Customers use AI to build applications in-house instead of buying them, the fear behind the 2026 sell-off in software stocks.
- Bookings keep slowing, as they did between the second and third quarters of 2026.
- Spending on AI grows faster than the revenue the AI tools bring in.
The parts of Roper Technologies's business
Roper Technologies reports three segments. Application Software is the largest, and most of the revenue growth in 2025 came from it, much of that growth from acquisitions.
| Share of revenue | Share of revenue growth | |
|---|---|---|
| Application Software | 56.7% | 71.2% |
| Network Software | 20.3% | 14.5% |
| Technology Enabled Products | 23.0% | 14.3% |
Roper Technologies beside its peers
Roper Technologies is compared here with seven companies, chosen to cover its niche software businesses, its data networks, its water meters and its way of buying businesses to keep.
- TYL: Software for governments and schools, against Frontline
- GWRE: Insurance software, against Vertafore
- VEEV: Software for one regulated industry, against Strata, Clinisys and CentralReach
- BSY: Project and asset software for engineers and utilities, against Deltek and PowerPlan
- VRSK: Data networks sold by subscription, against DAT, iPipeline and ConstructConnect
- BMI: Water meters, against Neptune
- AME: A serial buyer of niche businesses that it keeps, as Roper is
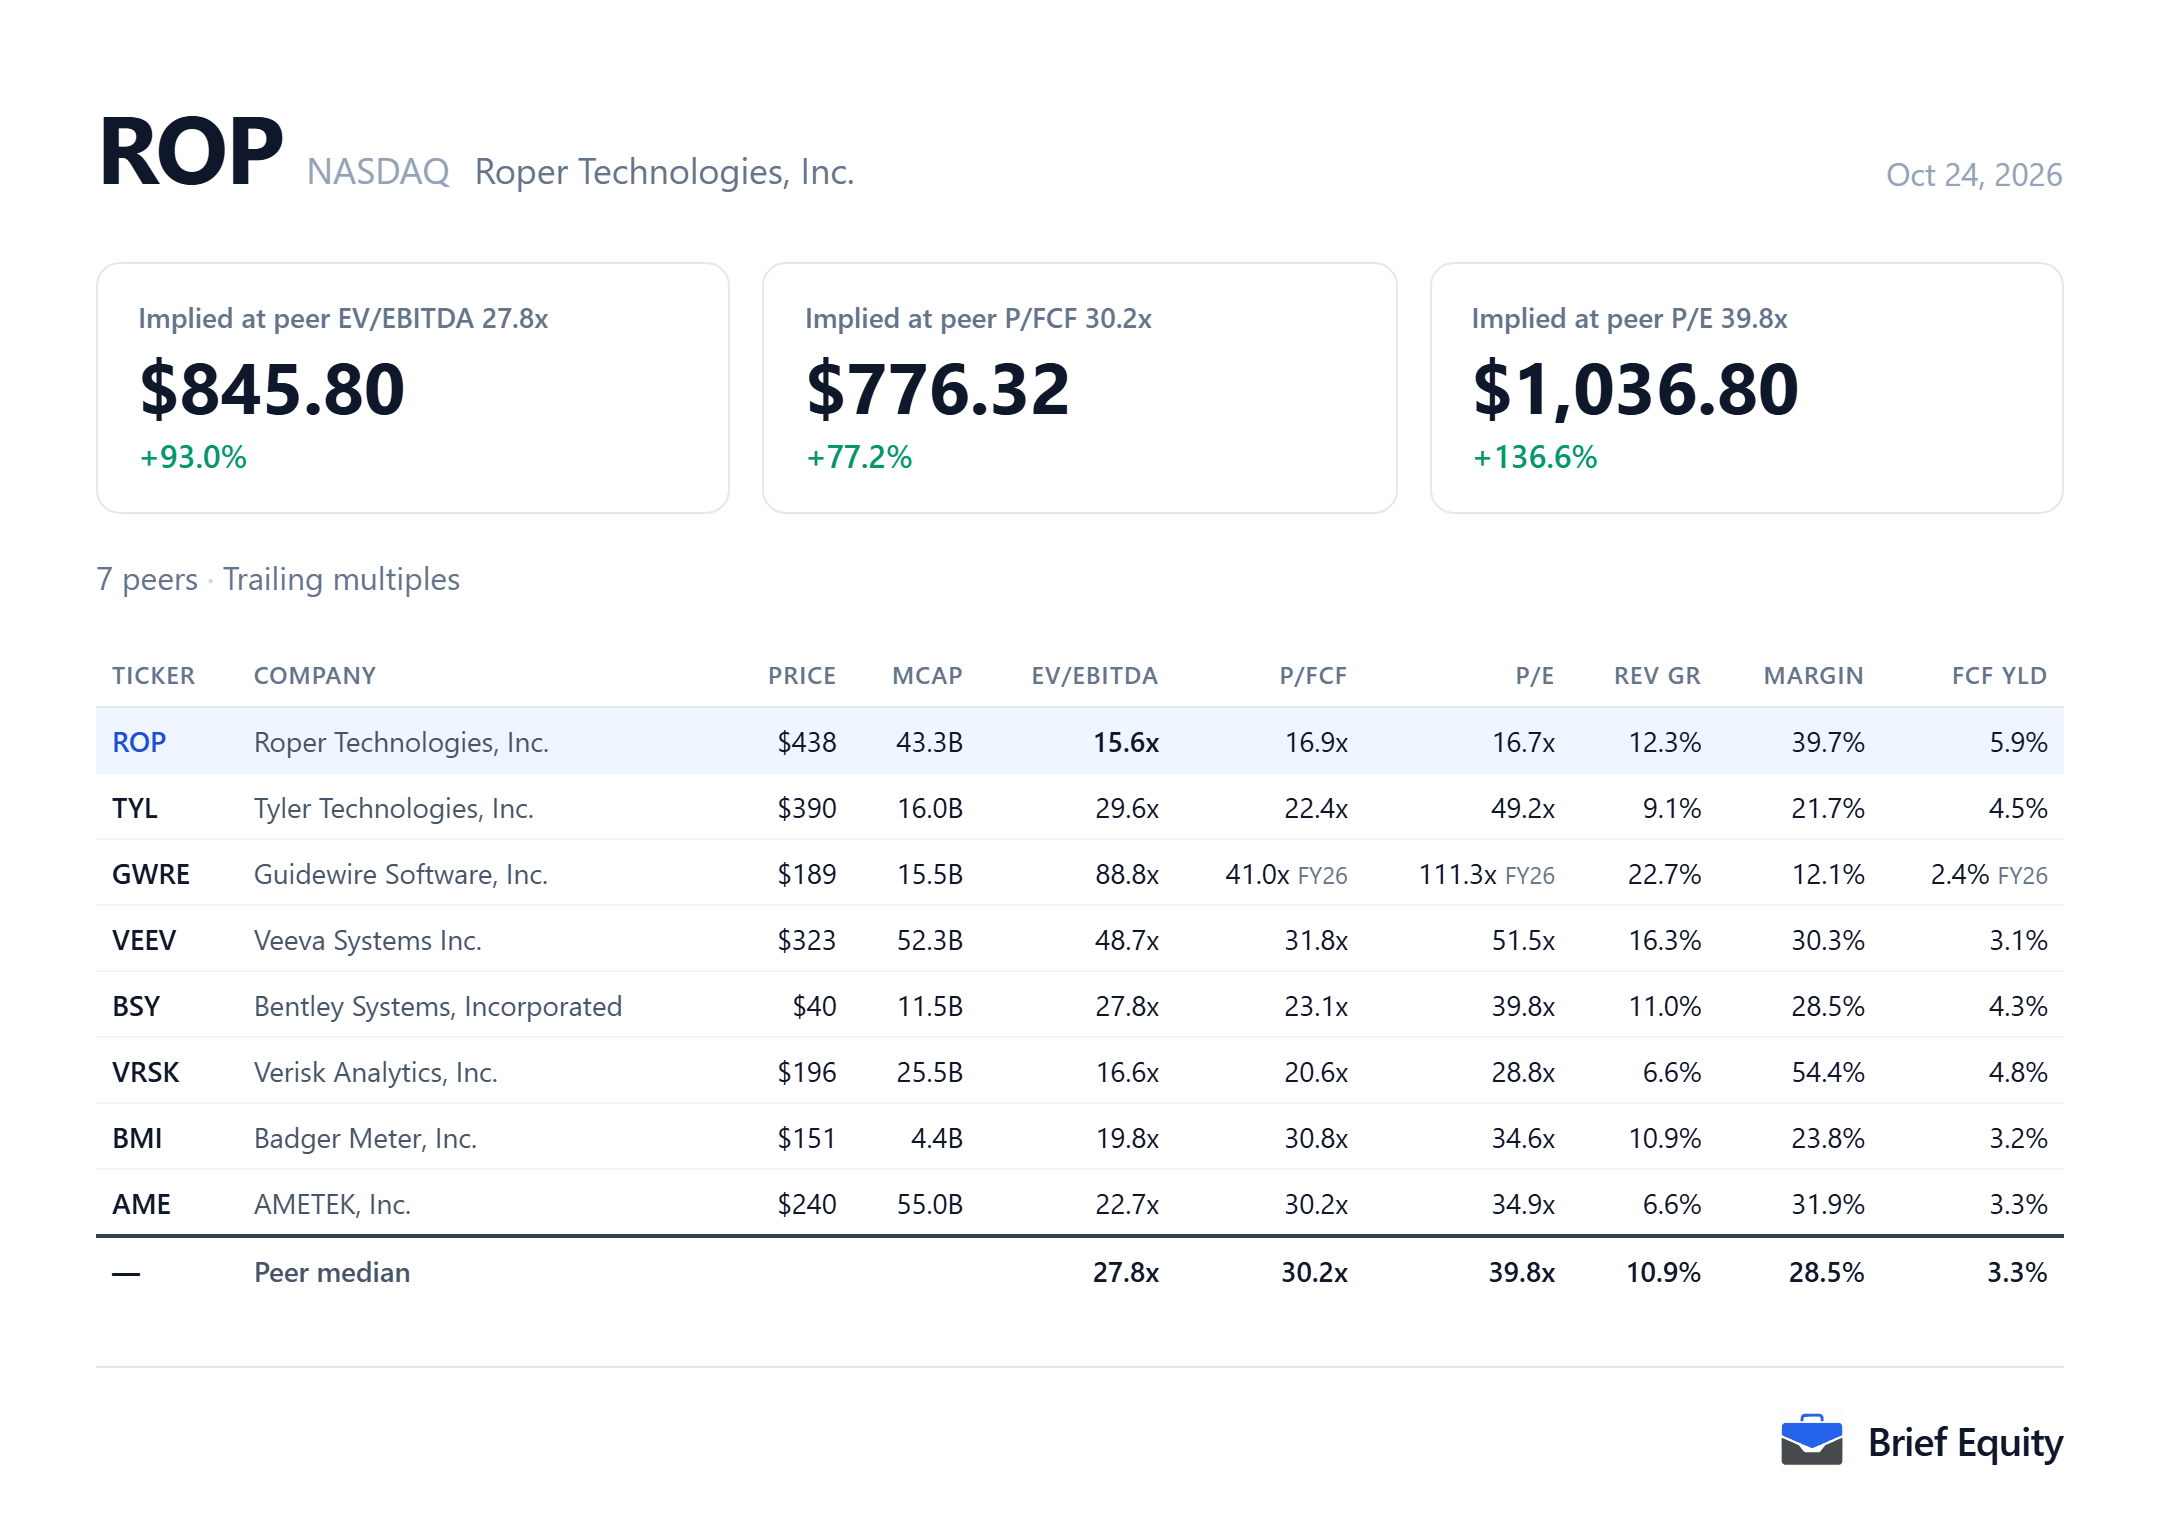
How the estimate moves with its assumptions
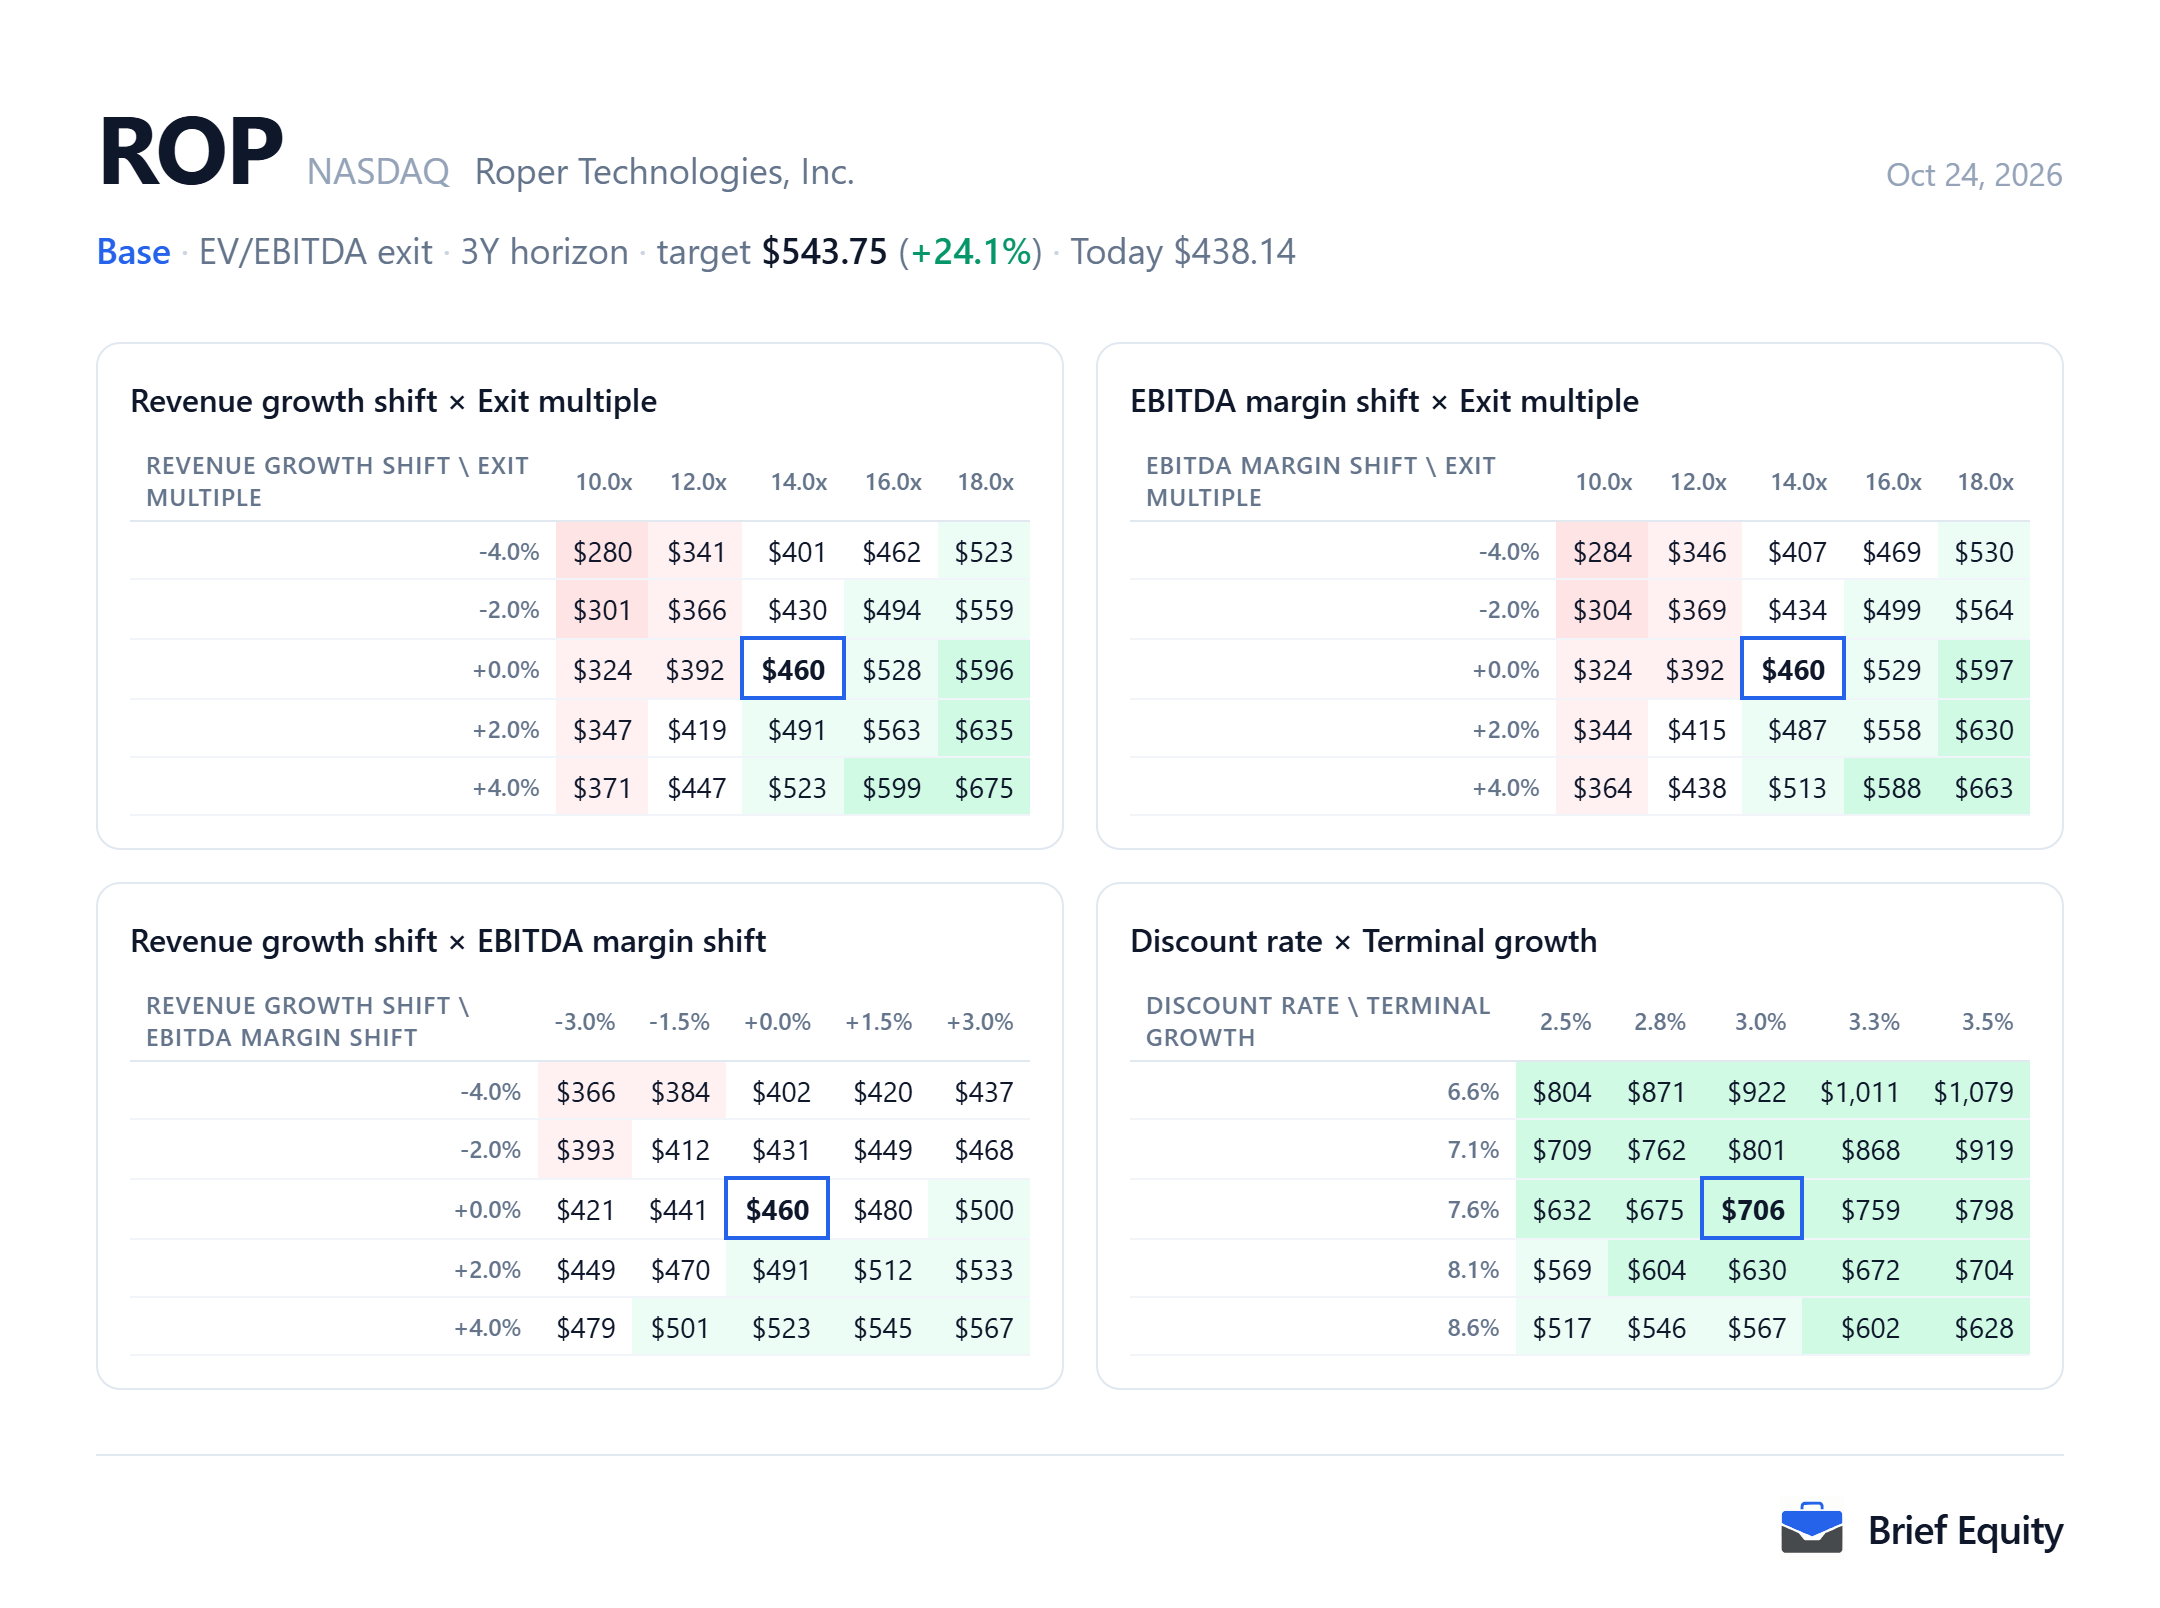
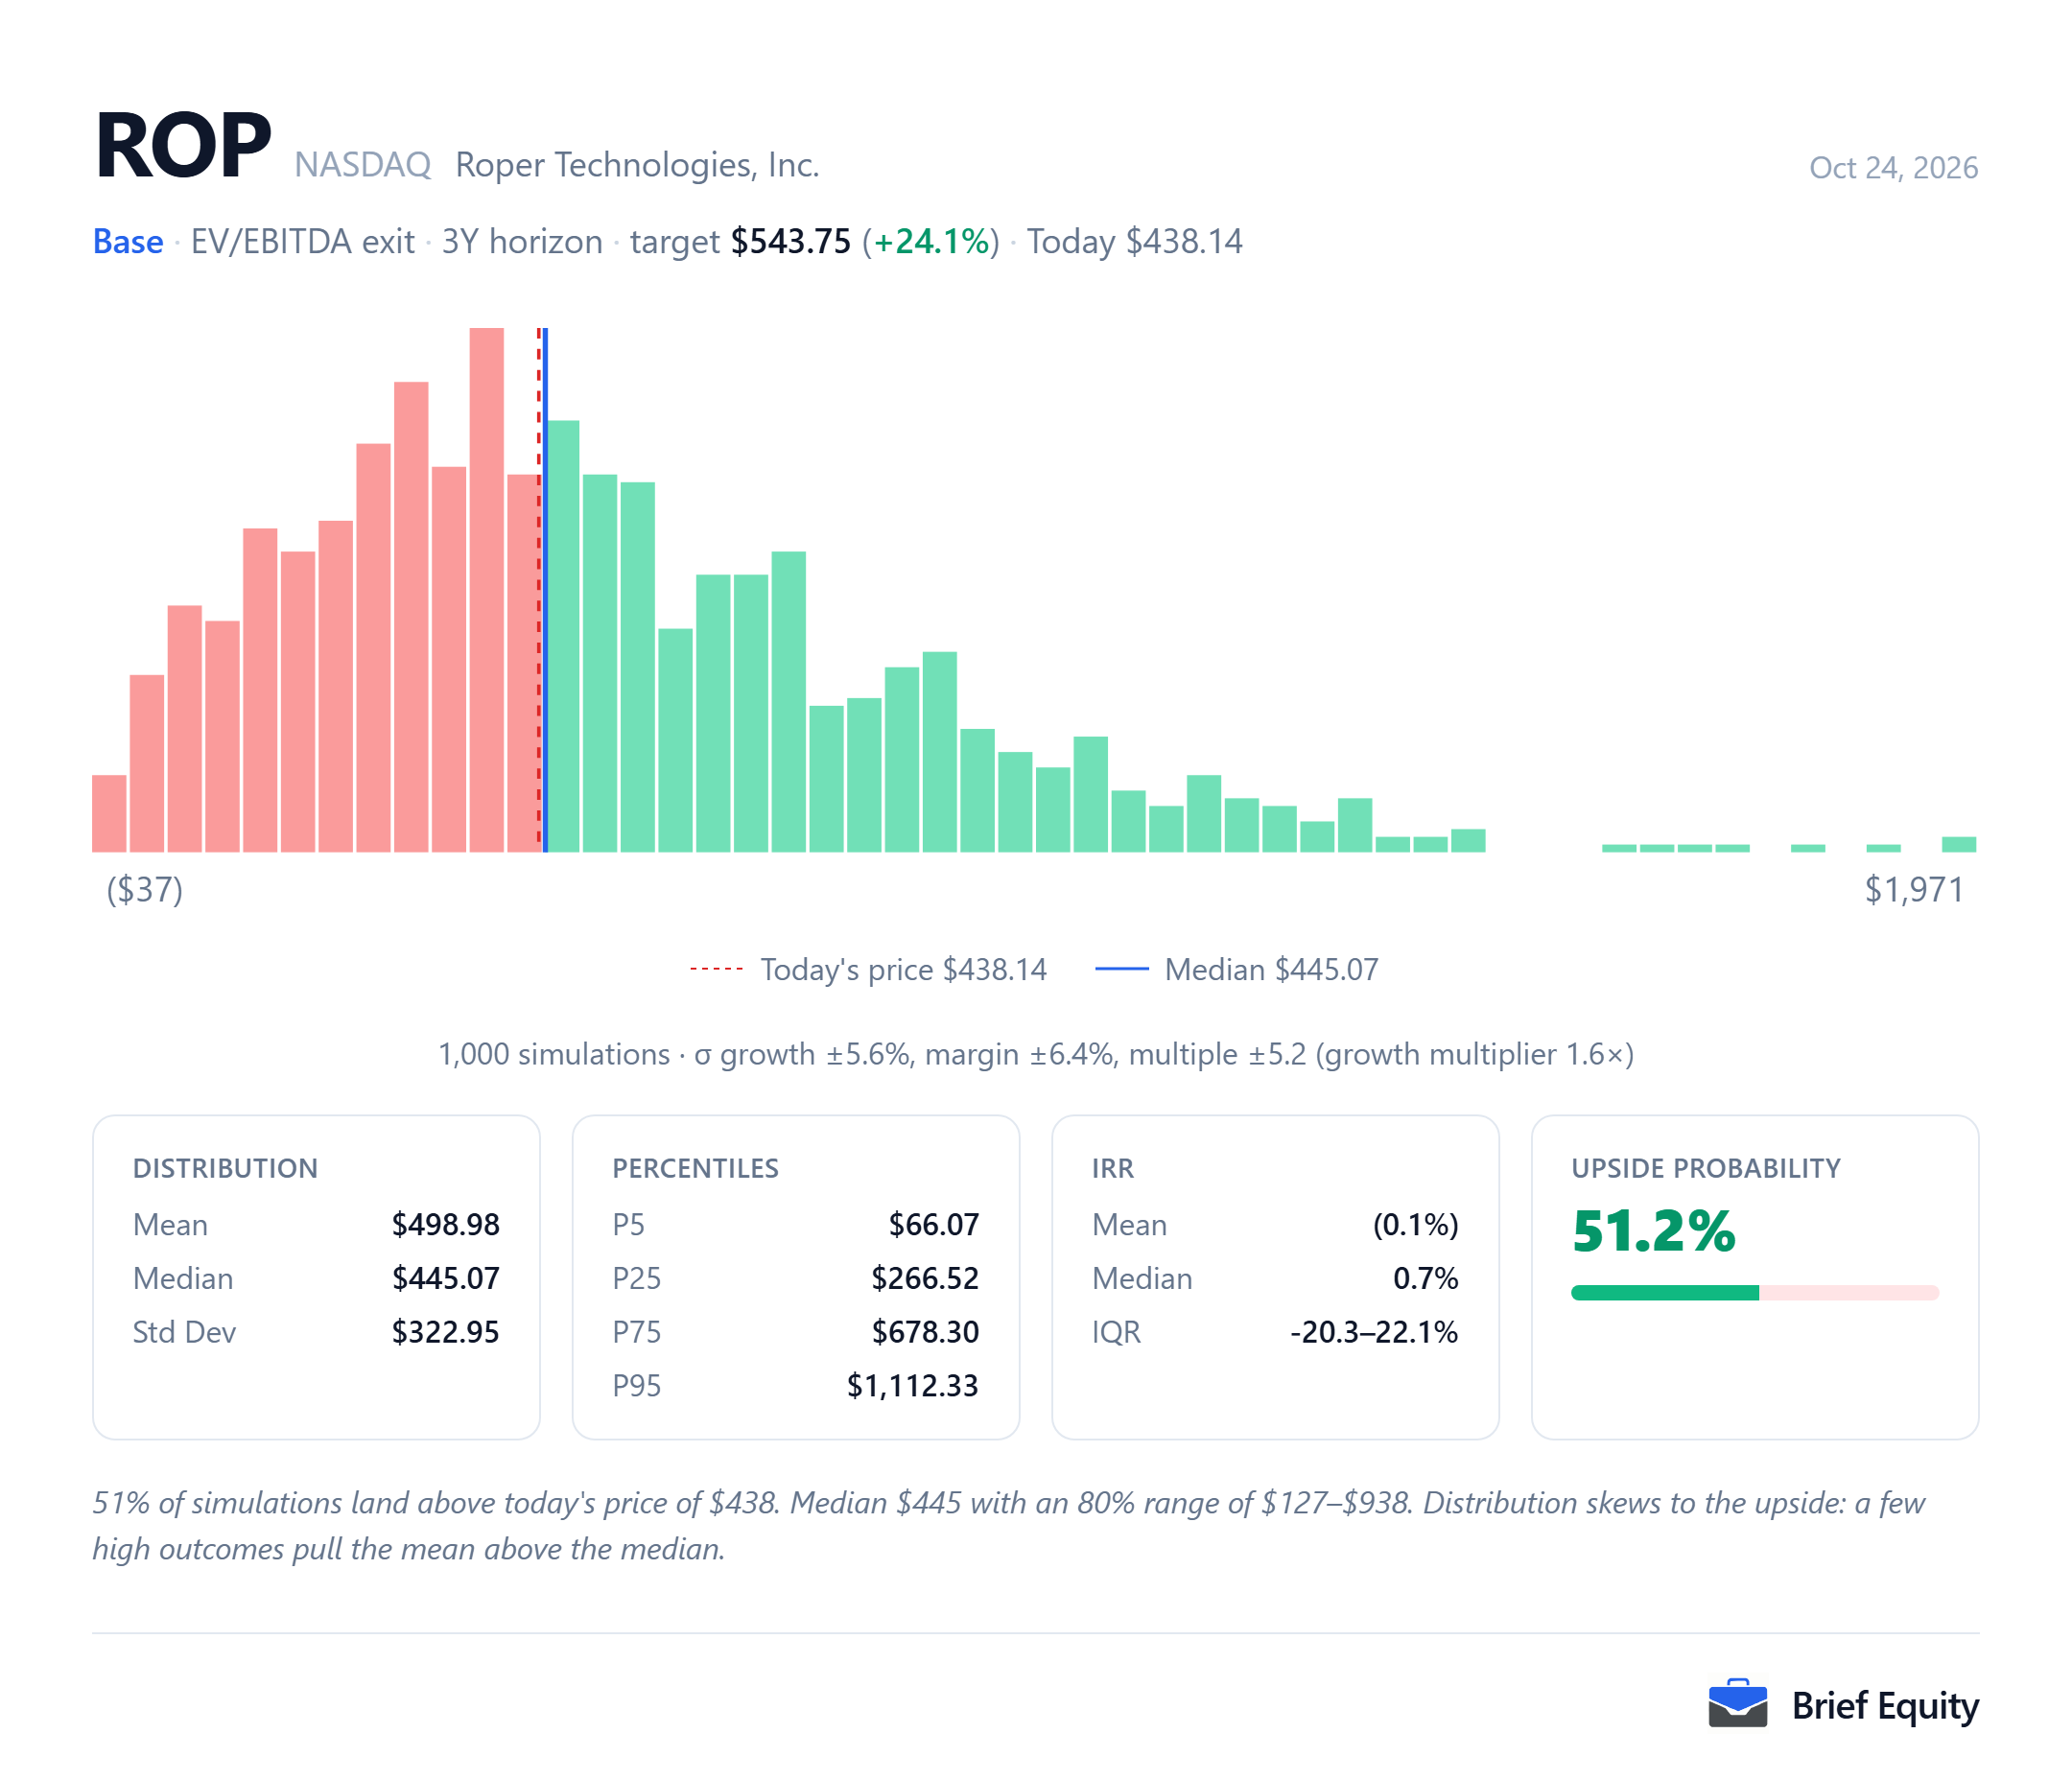
Roper Technologies' estimate depends on its assumptions, and the two pictures below show how far it moves when they change. The first varies two assumptions at a time. The second runs the model many times with growth, margin and the exit multiple drawn at random.
Questions about Roper Technologies
These questions about Roper Technologies (ROP) are answered from the documents listed under Sources.
- How much of Roper's 2025 revenue growth was organic?
- Roper's net revenues rose 12.3% to $7,902.5 million in 2025, of which 5.4 points were organic and 6.7 points came from acquisitions.
- How many shares did Roper buy back in 2026?
- In the six months ended June 30, 2026, Roper repurchased 7.865 million shares for $2,724.1 million, an average price of $346.34 a share.
- What is Roper's earnings guidance for 2026?
- In its third-quarter 2026 results Roper raised its full-year 2026 adjusted DEPS guidance to $22.35 to $22.40, from $22.15 to $22.30.
- How much debt does Roper have?
- At September 30, 2026 Roper reported $1,415.1 million of current debt and $8,304.6 million of long-term debt, against cash and cash equivalents of $311.0 million.
Sources
The quotations and facts about Roper Technologies (ROP) on this page rest on the documents below.
- Roper Technologies annual report (Form 10-K) for 2025, February 24, 2026
- Roper Technologies quarterly report (Form 10-Q) for the quarter ended June 30, 2026, July 31, 2026
- Roper Technologies third-quarter 2026 earnings release, October 22, 2026
- Roper Technologies third-quarter 2026 earnings call, October 22, 2026
- Roper Technologies second-quarter 2026 earnings call, July 23, 2026
- Roper's share price decline after its January 2026 guidance, April 7, 2026
- Roper's share price between its second- and third-quarter 2026 reports, October 22, 2026
- Roper's share price move on its third-quarter 2026 results, October 23, 2026
- US software stocks reach 2026 highs as AI disruption worries fade, October 6, 2026
About this page
Brief Equity and its team hold no position in Roper Technologies (ROP) as of October 24, 2026.
This page is research, not investment advice. It describes one model and the assumptions behind it, and market data is delayed. Read how these models are built and our editorial policy.
Related guides: EV/EBITDA explained, What is enterprise value (EV), What is an economic moat.