Valuation · DCF model
Is IQVIA (IQV) stock overvalued?
Brief Equity's quick DCF model of IQVIA, dated October 29, 2026, values the shares at about $251 today, about 10% below the share price of $279.04, the previous day's close. On analyst consensus growth IQVIA looks somewhat expensive after its shares climbed from $156.66 in April 2026. It could still be an opportunity if its order book lifts revenue growth to about 8.8% a year, the rate the share price implies with the rest of the model unchanged.
By The Brief Equity Team · Model dated · Published
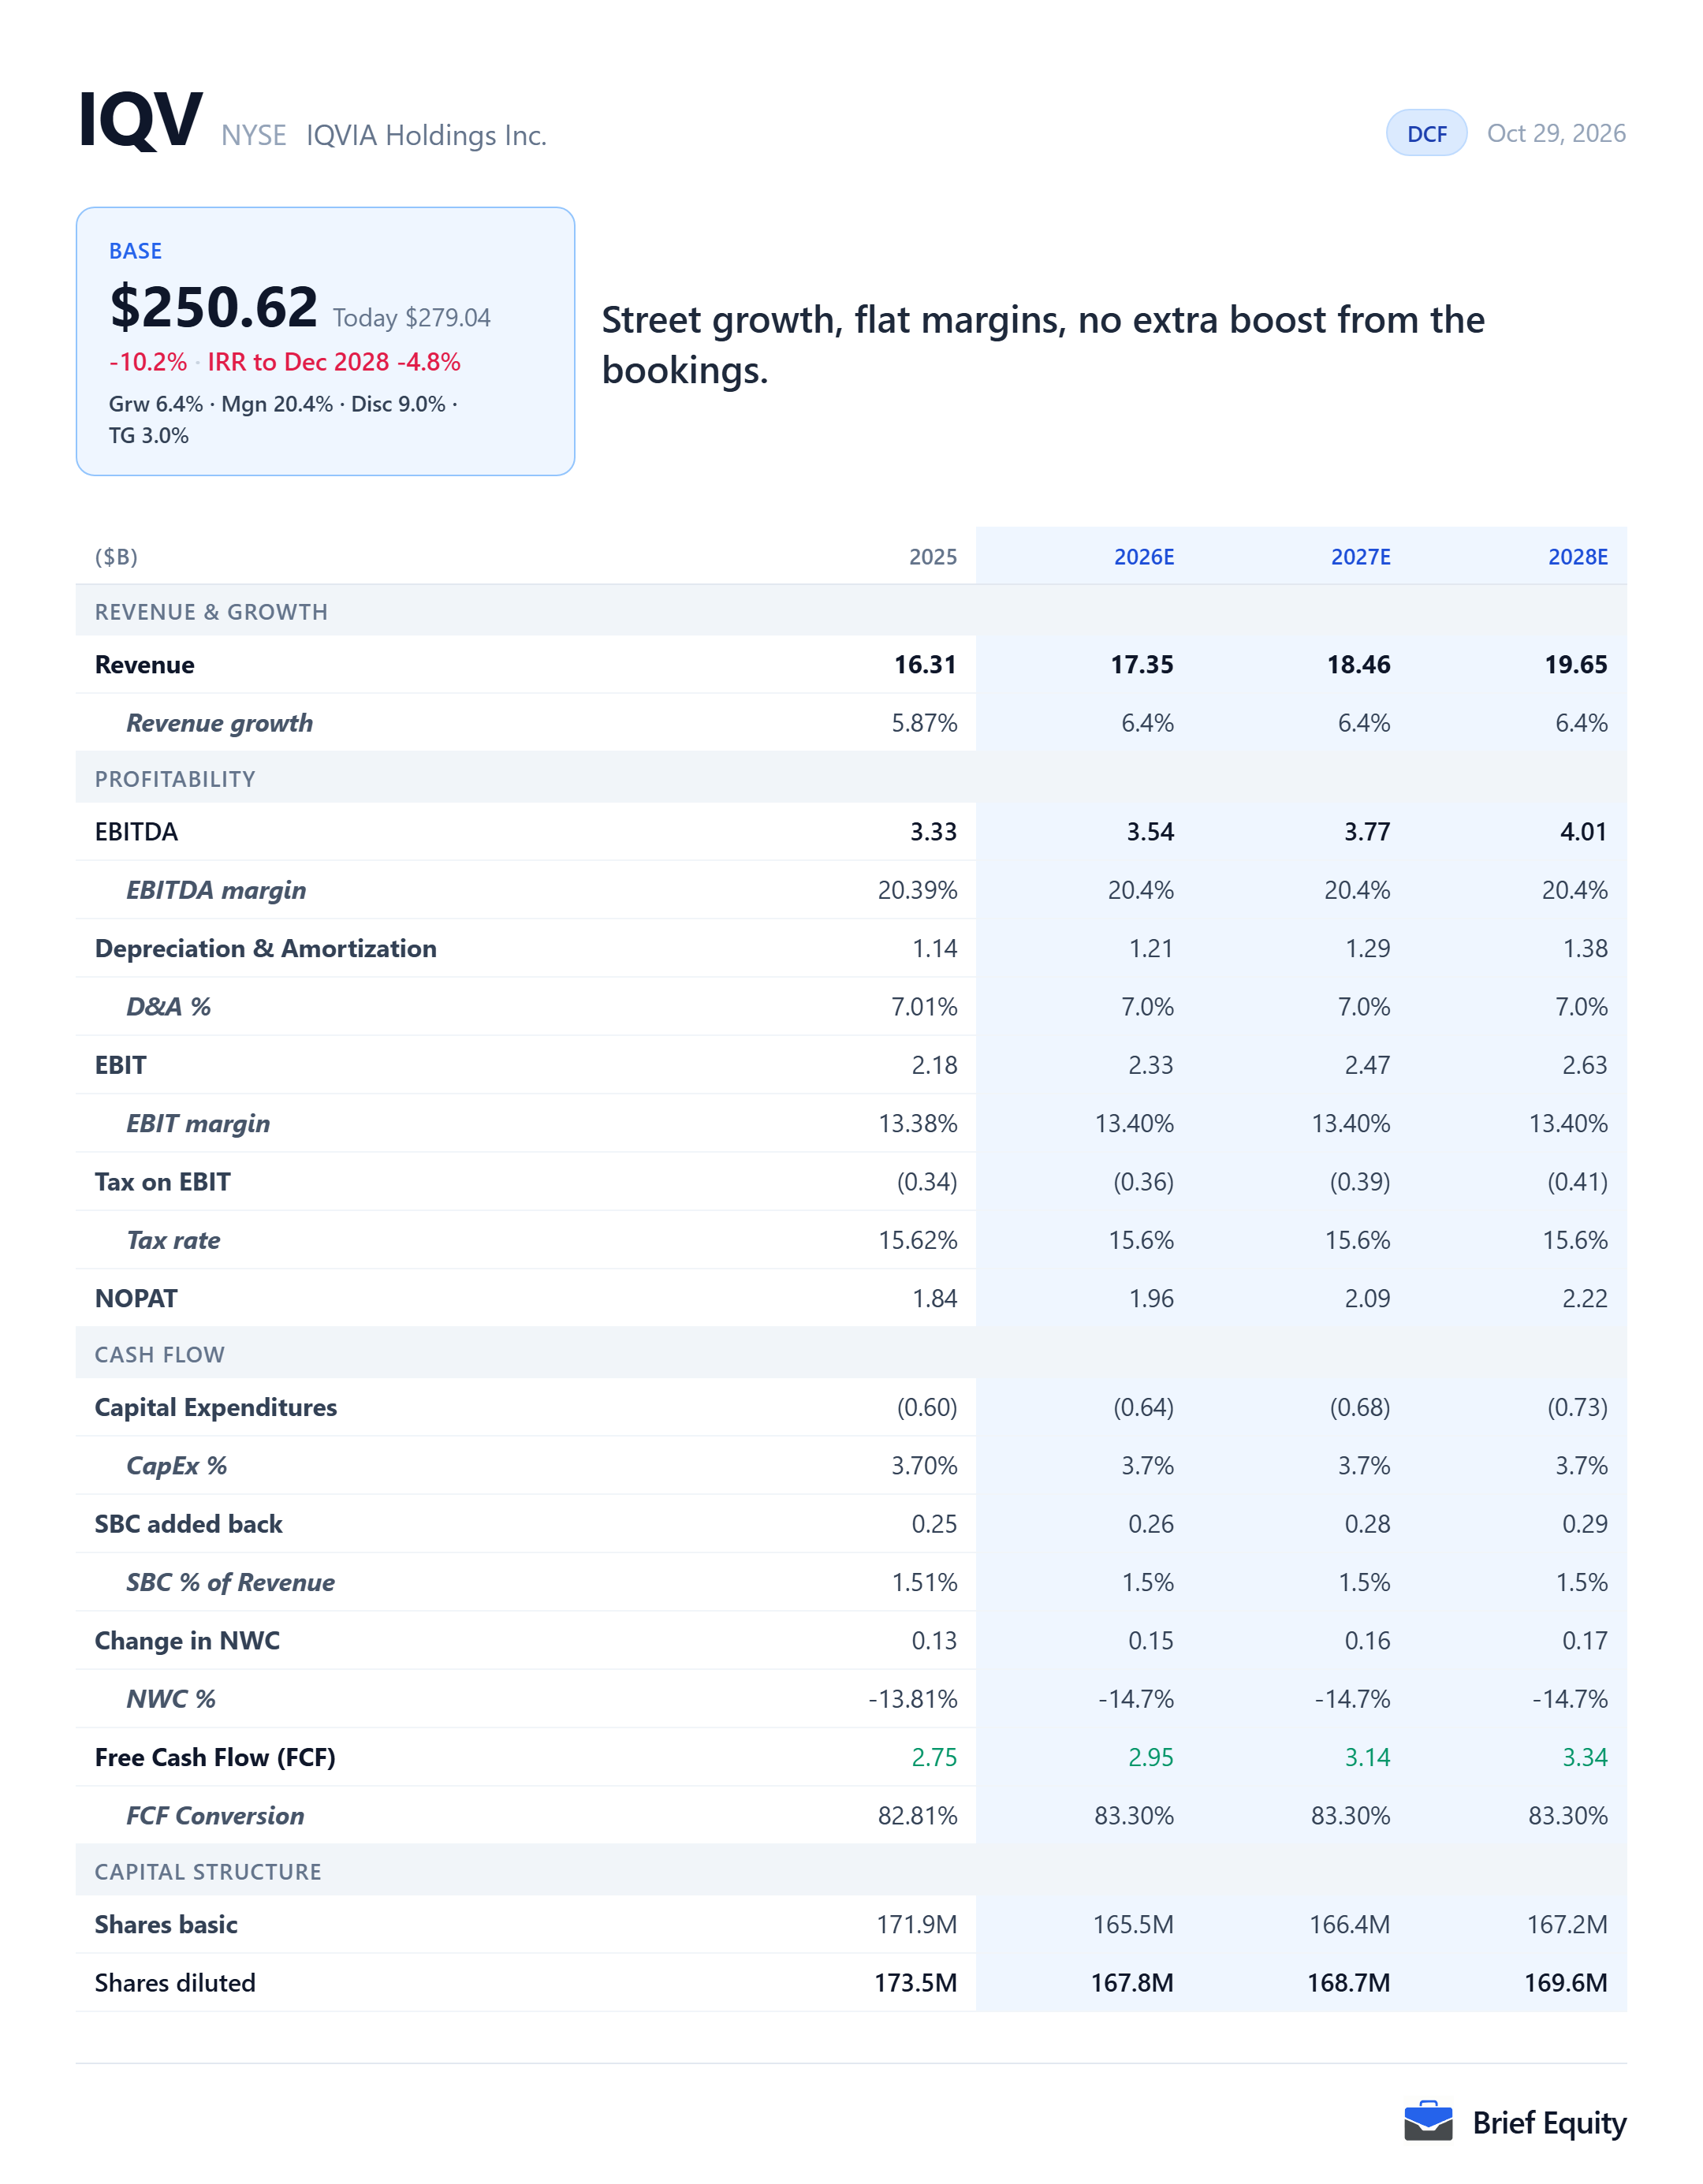
The model's assumptions for IQVIA
IQVIA's fiscal year is the calendar year and it reports in US dollars. The model runs three years, to 2028, with revenue growing at the analyst consensus rate, and the second table sets the model's revenue beside analyst consensus revenue for the same years.
| 2026 | 2027 | 2028 | |
|---|---|---|---|
| Revenue, model | 17.35 | 18.46 | 19.65 |
| Revenue growth, model | 6.4% | 6.4% | 6.4% |
| EBITDA, model | 3.54 | 3.77 | 4.01 |
| EBITDA margin, model | 20.4% | 20.4% | 20.4% |
| Free cash flow, model | 2.95 | 3.14 | 3.34 |
| 2026 | 2027 | 2028 | |
|---|---|---|---|
| Revenue, model | 17.35 | 18.46 | 19.65 |
| Revenue, analyst consensus | 17.45 | 18.50 | 19.64 |
Why IQVIA looks overvalued
IQVIA's share price closed at $279.04 on October 28, 2026, up from $156.66 on April 29, 2026, and close to $282.61, its closing price on December 30, 2021. Brief Equity's model suggests the shares look somewhat expensive at that price, though they could be an opportunity if the company's order book lifts revenue growth well above the rate analysts expect.
IQVIA's clinical bookings support that more hopeful view. Net new bookings in R&D Solutions were $3.2 billion in the third quarter of 2026, up 15% on a year earlier and the company's strongest clinical quarter since 2022, and bookings over the last twelve months reached $11.7 billion, up 14%.
“Third quarter net new bookings were $3.2 billion, up 15% year-over-year, representing a book-to-bill ratio of 1.2x. Last-twelve-month net new bookings were $11.7 billion, up 14% year-over-year.”
IQVIA third-quarter 2026 results release, October 27, 2026
IQVIA's revenue has not yet grown at that pace. The company guides 2026 revenue growth of 6.4% to 7.3%, a range that includes 250 basis points from acquisitions, and the chief financial officer put organic growth in the third quarter at approximately 6%.
In the model, IQVIA's revenue grows at the analyst consensus rate of 6.4% a year through 2028, and the discounted cash flows come to about $251 a share today, about 10% below the price. Holding the rest of the model unchanged, the share price of $279.04 implies revenue growth of 8.8% a year.
IQVIA's chief executive puts the long-term growth of large pharmaceutical companies' research and development spending at 2% to 3% a year, and large pharmaceutical companies account for approximately 50% of IQVIA's R&D Solutions revenue.
What has to be true, and what would break it
IQVIA looks expensive on this model while a few things hold, and the view fails if they stop holding.
What has to be true
- IQVIA's revenue keeps growing close to the analyst consensus rate in 2027 and 2028.
- Organic growth stays near the approximately 6% of the third quarter of 2026, with acquisitions supplying the rest of reported growth.
- Spending on research and development by large pharmaceutical companies keeps growing at the 2% to 3% a year the chief executive describes.
What would break it
- The bookings of 2026 turn into revenue growth well above the analyst consensus rate in 2027 and 2028, without further acquisitions.
- Emerging biopharmaceutical companies, about 35% of R&D Solutions revenue, keep raising funding and starting trials at a faster pace.
The parts of IQVIA's business
IQVIA reported three segments for 2025, before moving to two segments on January 1, 2026, and the shares below cover the full year 2025.
| Share of revenue | Share of revenue growth | |
|---|---|---|
| Research & Development Solutions | 54.5% | 40.8% |
| Technology & Analytics Solutions | 40.6% | 51.5% |
| Contract Sales & Medical Solutions | 4.8% | 7.7% |
IQVIA beside its peers
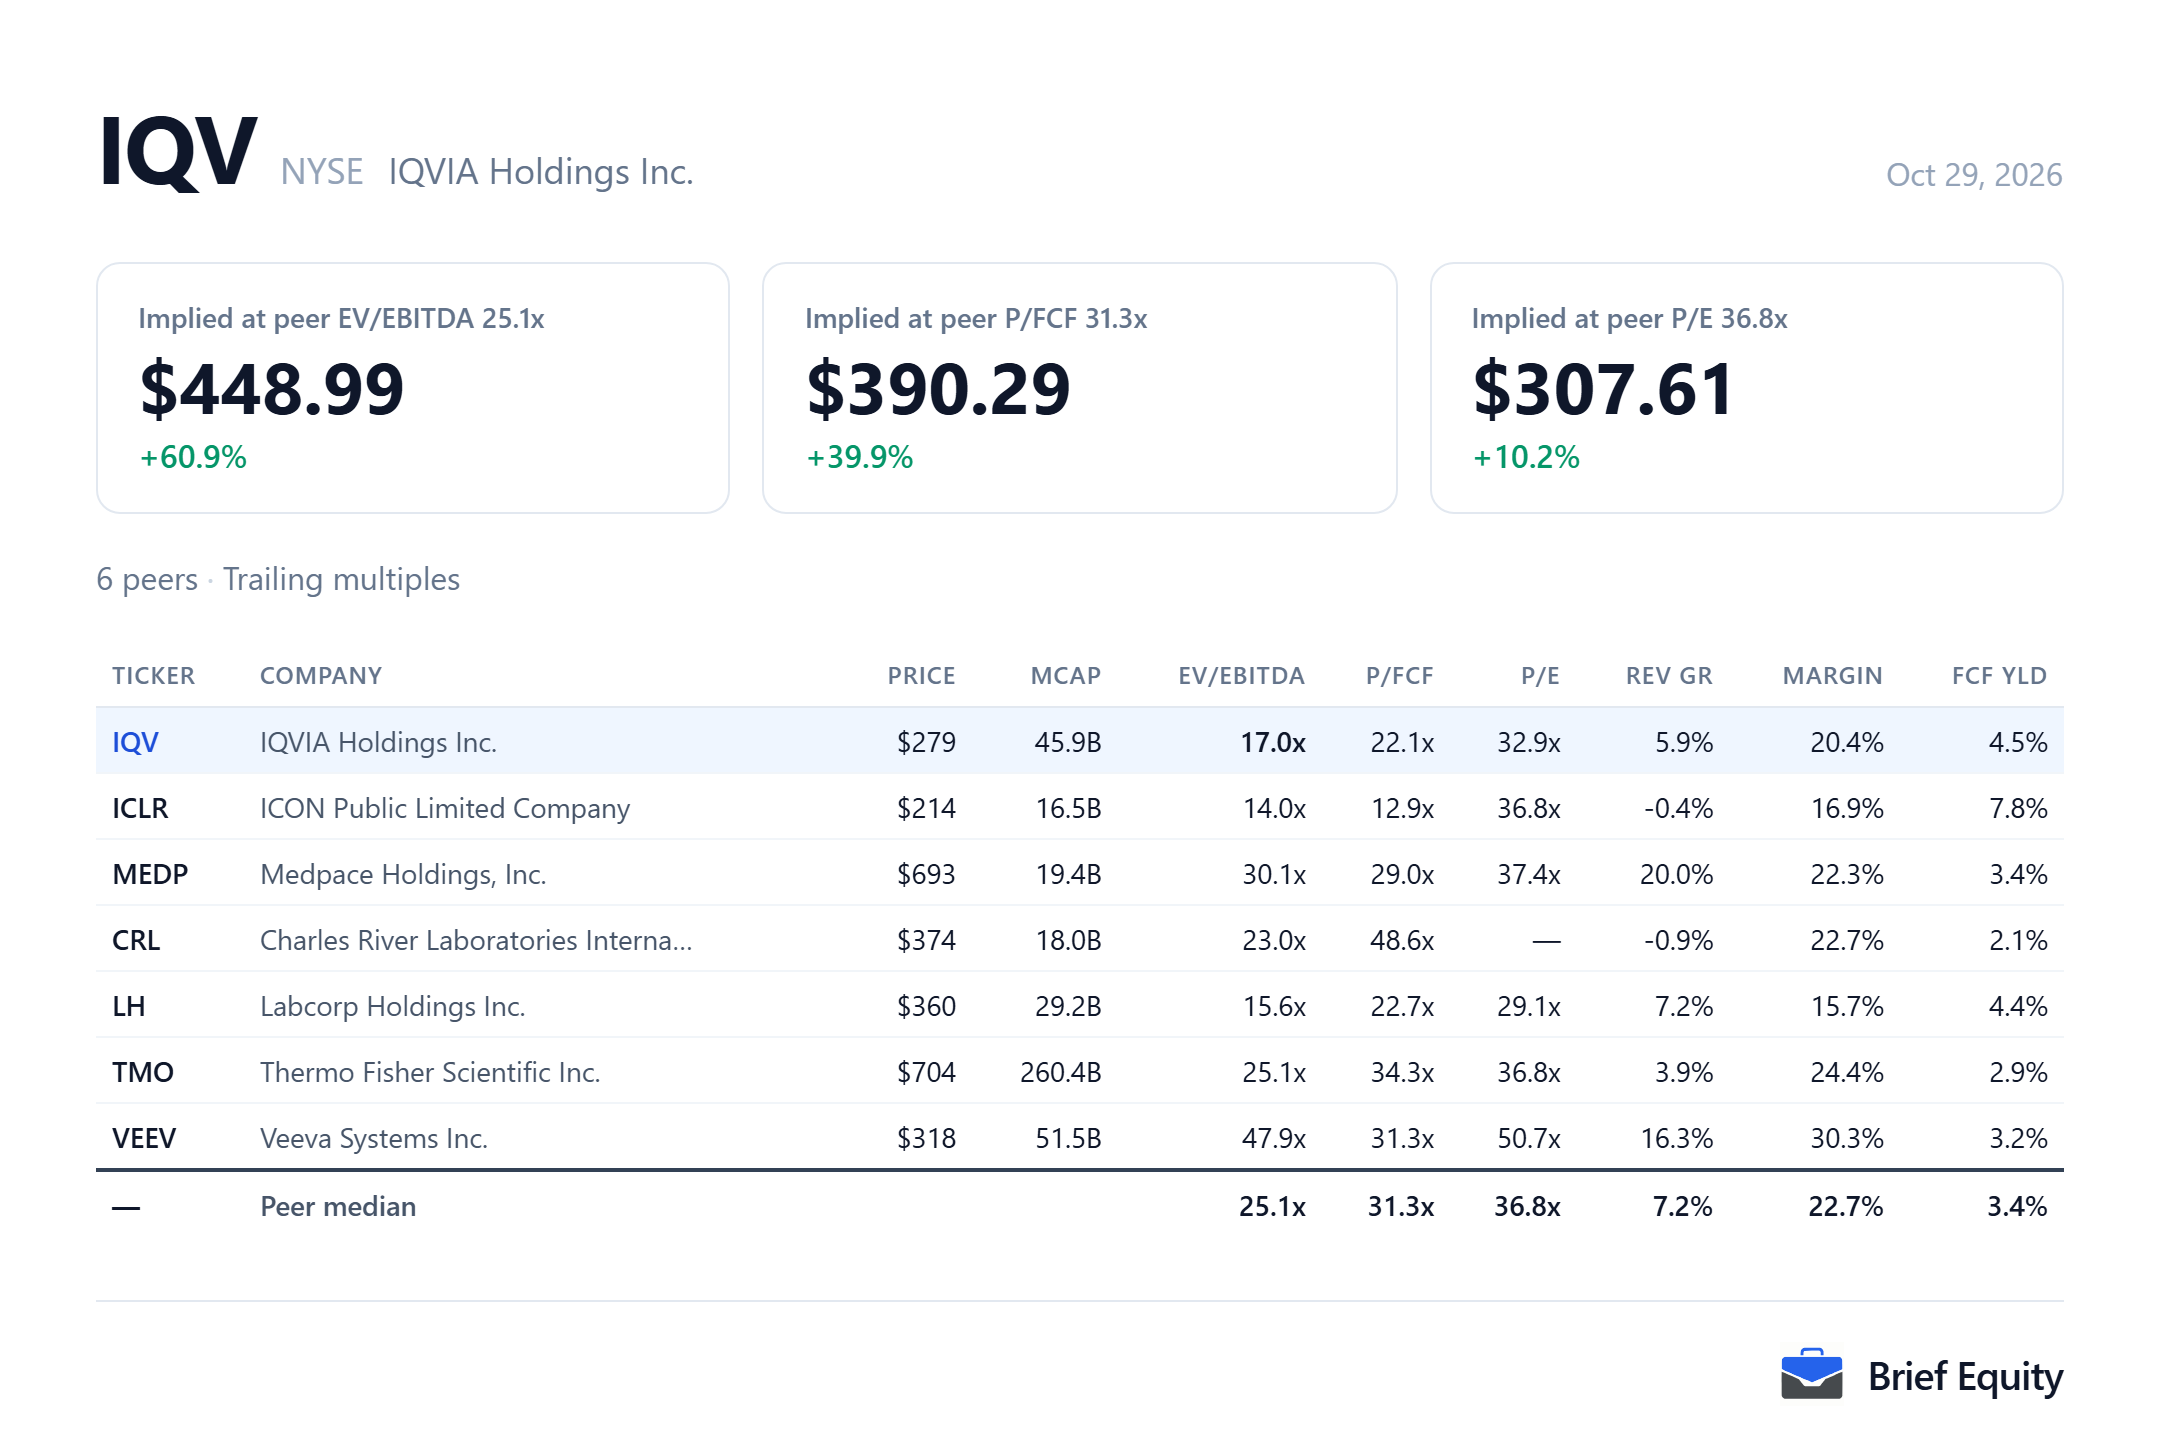
IQVIA is compared here with six US-listed companies chosen to cover its clinical research and its commercial data businesses.
- ICLR: Clinical trial services, against R&D Solutions
- MEDP: Clinical trial services for smaller biotechnology companies
- CRL: Early-stage drug research services
- LH: Central laboratory services for clinical trials
- TMO: Clinical research services through PPD, inside a laboratory tools company
- VEEV: Life sciences software and data, against Commercial Solutions
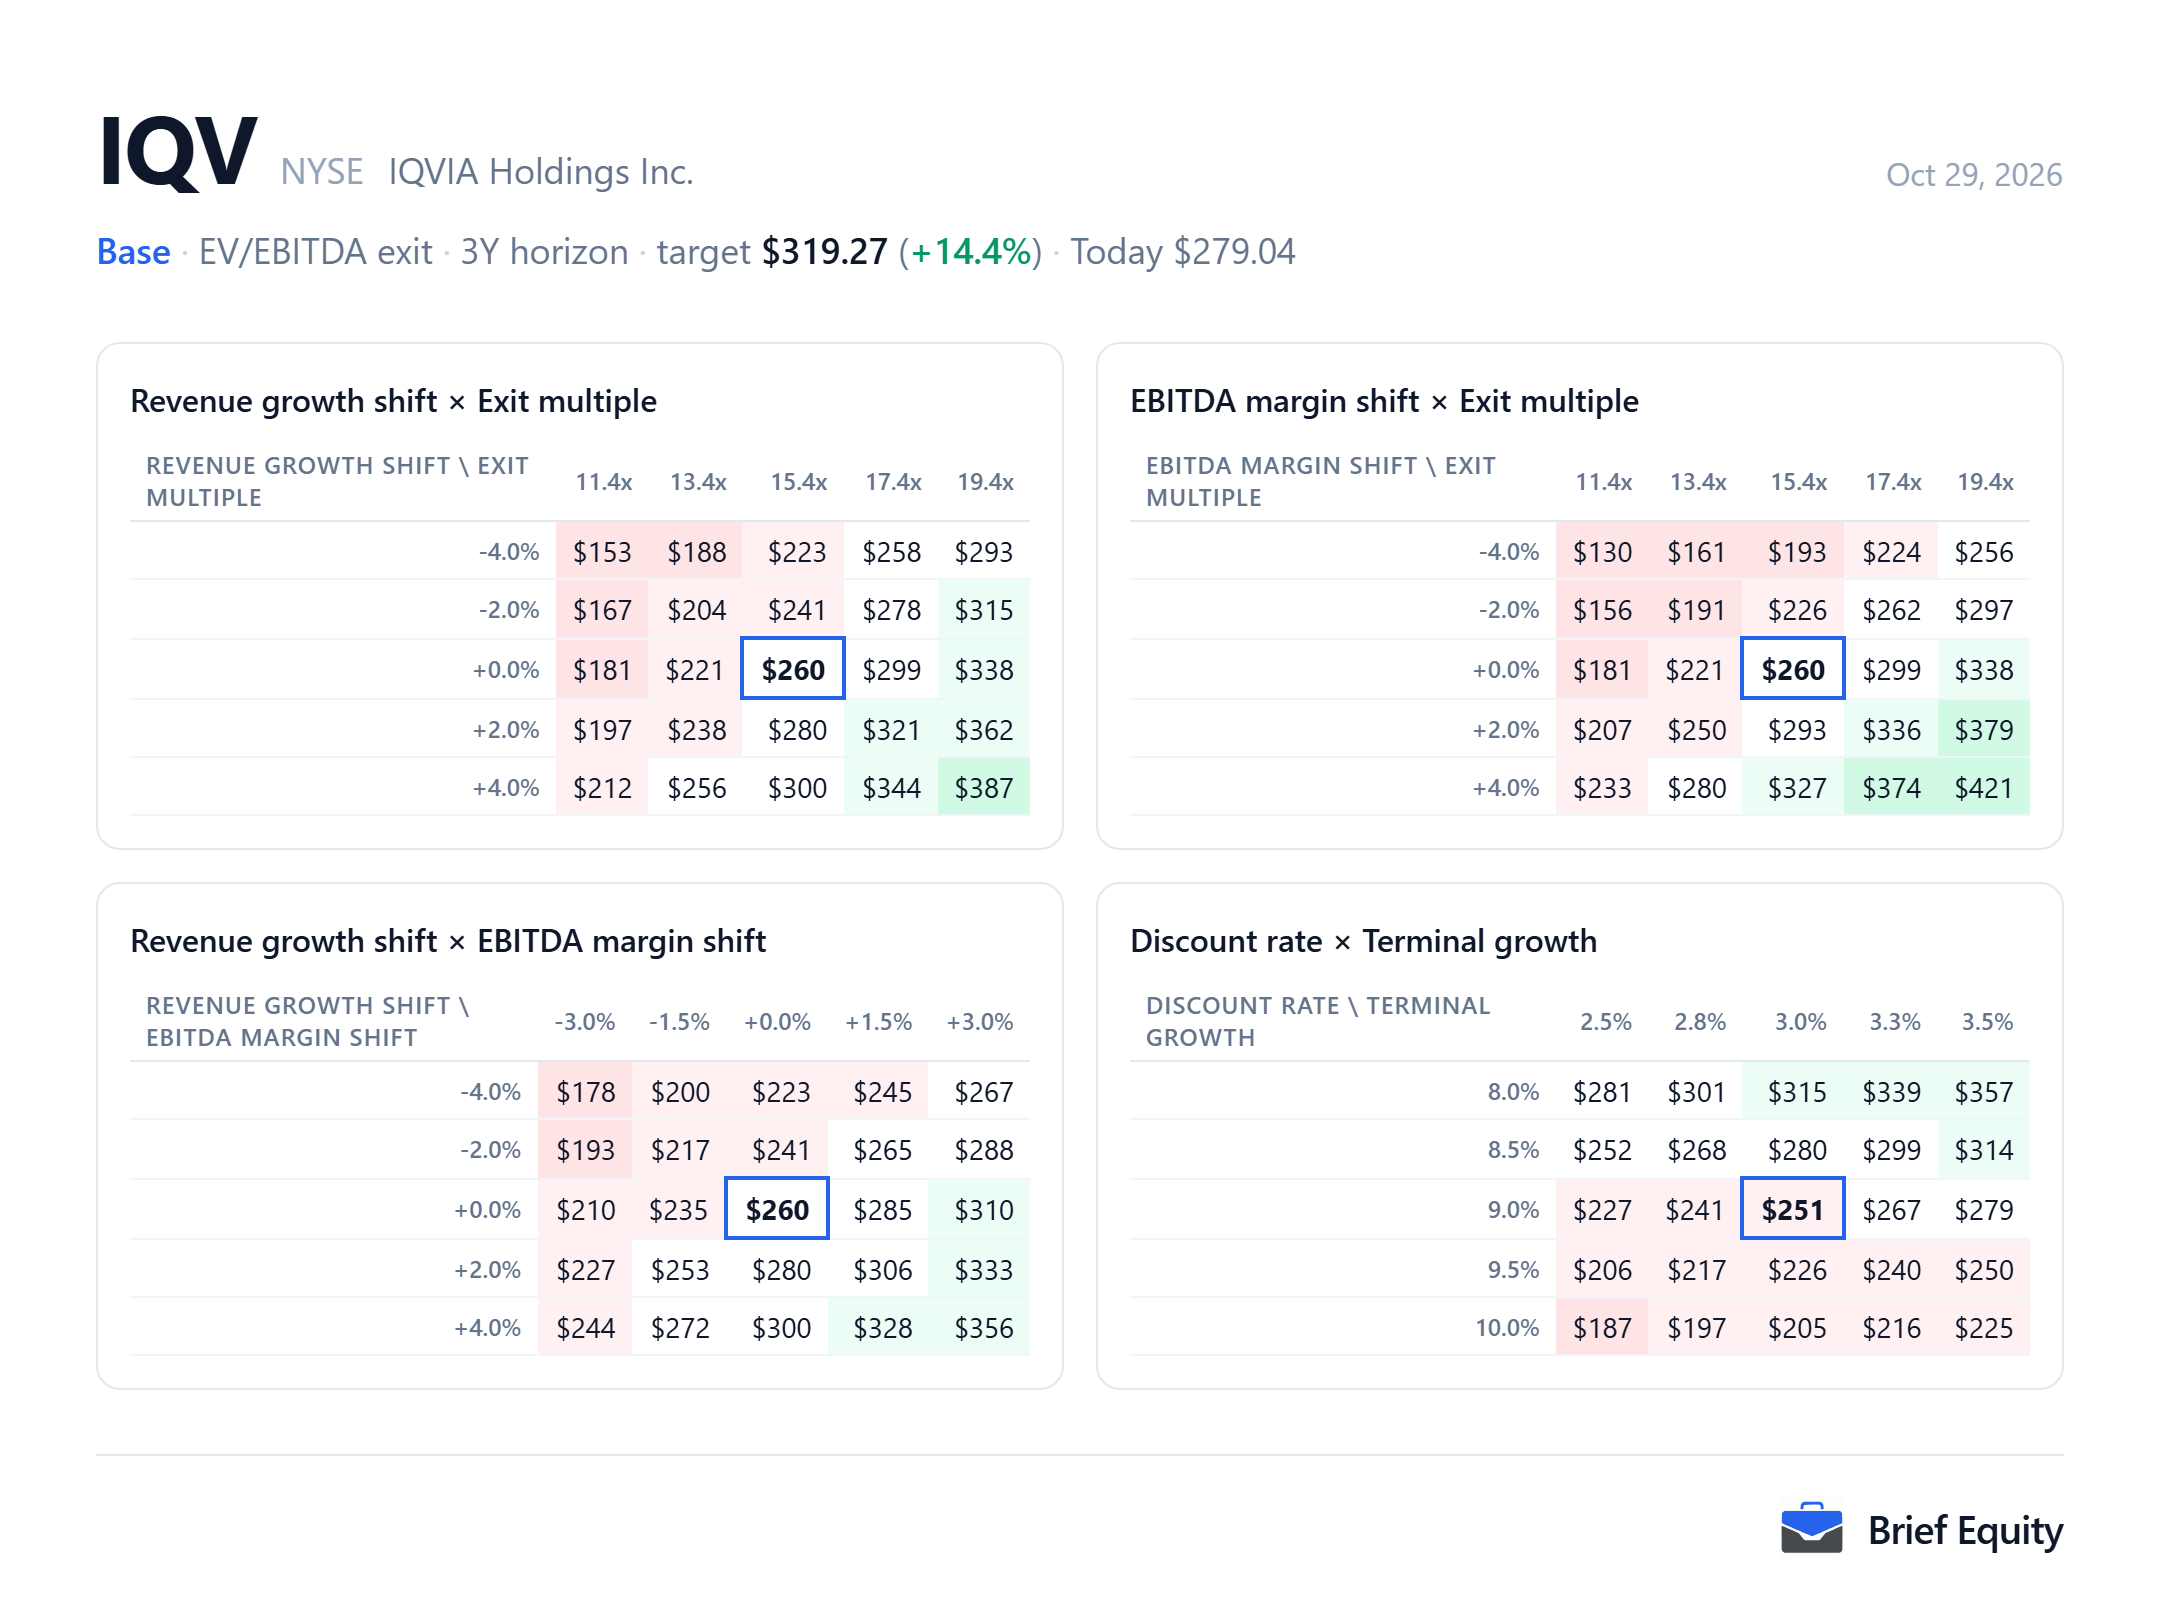
How the estimate moves with its assumptions
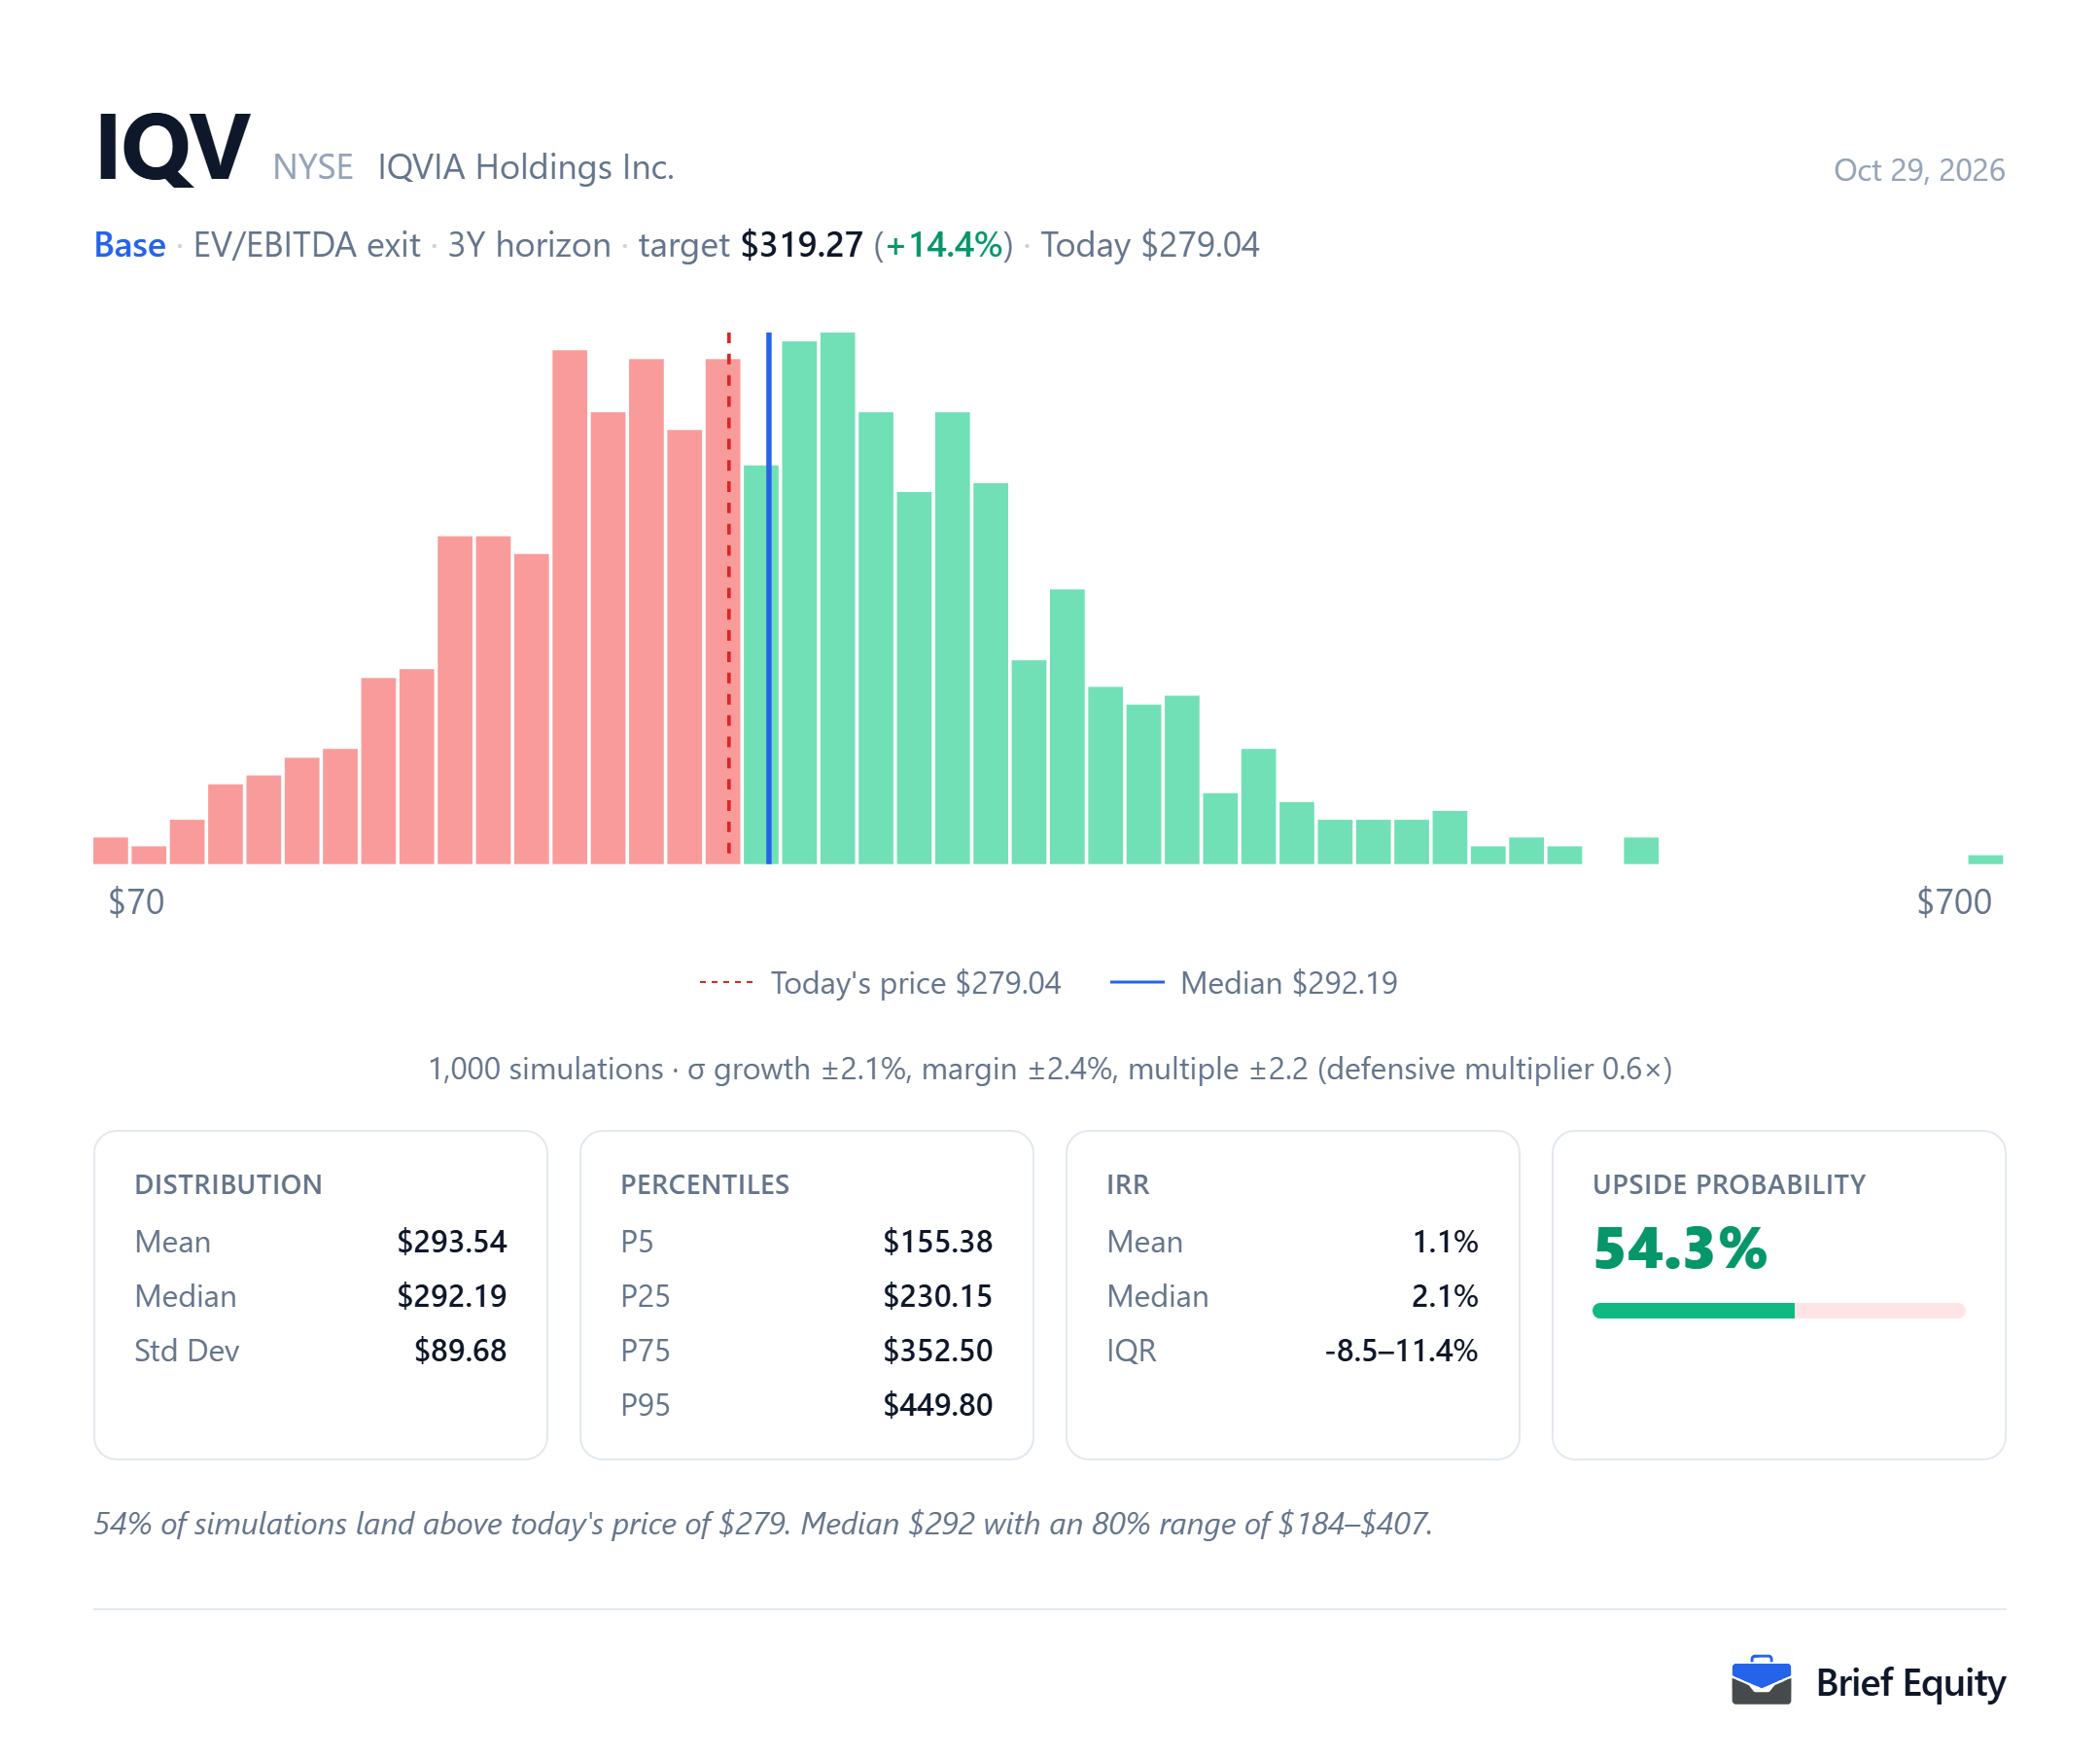
The two pictures below show how far the IQVIA estimate moves when its assumptions change: one moves two assumptions at a time, and the other runs the model many times with growth, margin and the exit multiple drawn at random.
Questions about IQVIA
These questions about IQVIA (IQV) are answered from the documents listed under Sources.
- Why did IQVIA's backlog fall in the third quarter of 2026?
- IQVIA removed approximately $2.1 billion of inactive trials from its R&D Solutions backlog after a review, leaving contracted backlog of $32.6 billion at September 30, 2026. The company said the adjustment has no impact on historical results, 2026 guidance, book-to-bill or next-twelve-month revenue from backlog.
- When will IQVIA give its 2027 outlook?
- IQVIA will host an Investor Day on December 1, 2026, where it said it will share a broad framework for 2027. It plans to give detailed 2027 guidance with its fourth-quarter results in February 2027.
- How much debt does IQVIA have?
- At September 30, 2026, IQVIA's debt was $16,067 million and its cash and cash equivalents were $2,249 million, for net debt of $13,818 million. Its net leverage ratio was 3.45x trailing twelve-month Adjusted EBITDA.
- How did IQVIA change its segments in 2026?
- From January 1, 2026, IQVIA reports two segments, Commercial Solutions and Research & Development Solutions. Contract Sales & Medical Solutions was folded into Technology & Analytics Solutions, renamed Commercial Solutions, and Real-World Late Phase moved to Research & Development Solutions.
Sources
The quotations and facts about IQVIA (IQV) on this page rest on the documents below.
- IQVIA third-quarter 2026 results release, October 27, 2026
- IQVIA quarterly report (Form 10-Q) for the third quarter of 2026, October 27, 2026
- IQVIA annual report (Form 10-K) for 2025, February 17, 2026
- IQVIA third-quarter 2026 earnings call, October 27, 2026
- IQVIA second-quarter 2026 earnings call, July 28, 2026
- Daily closing prices for IQVIA (IQV), 2020 to 2026, October 29, 2026
About this page
Brief Equity and its team hold no position in IQVIA (IQV) as of October 29, 2026.
This page is research, not investment advice. It describes one model and the assumptions behind it, and market data is delayed. Read how these models are built and our editorial policy.
Related guides: DCF explained (discounted cash flow), How to build a DCF model (step by step), What is free cash flow.