Valuation · DCF model
Is D2L (DTOL.TO) stock undervalued?
Brief Equity's DCF model of D2L (DTOL.TO), dated October 14, 2026, values the shares at CAD 15 today, about 38% above the CAD 10.93 share price at that date. The stock looks somewhat undervalued, though not by a wide margin after the company lowered its revenue outlook in September 2026. The estimate holds if the business outside the K-12 market keeps growing about 10% a year once the K-12 customer losses are out of reported revenue.
By The Brief Equity Team · Model dated · Published
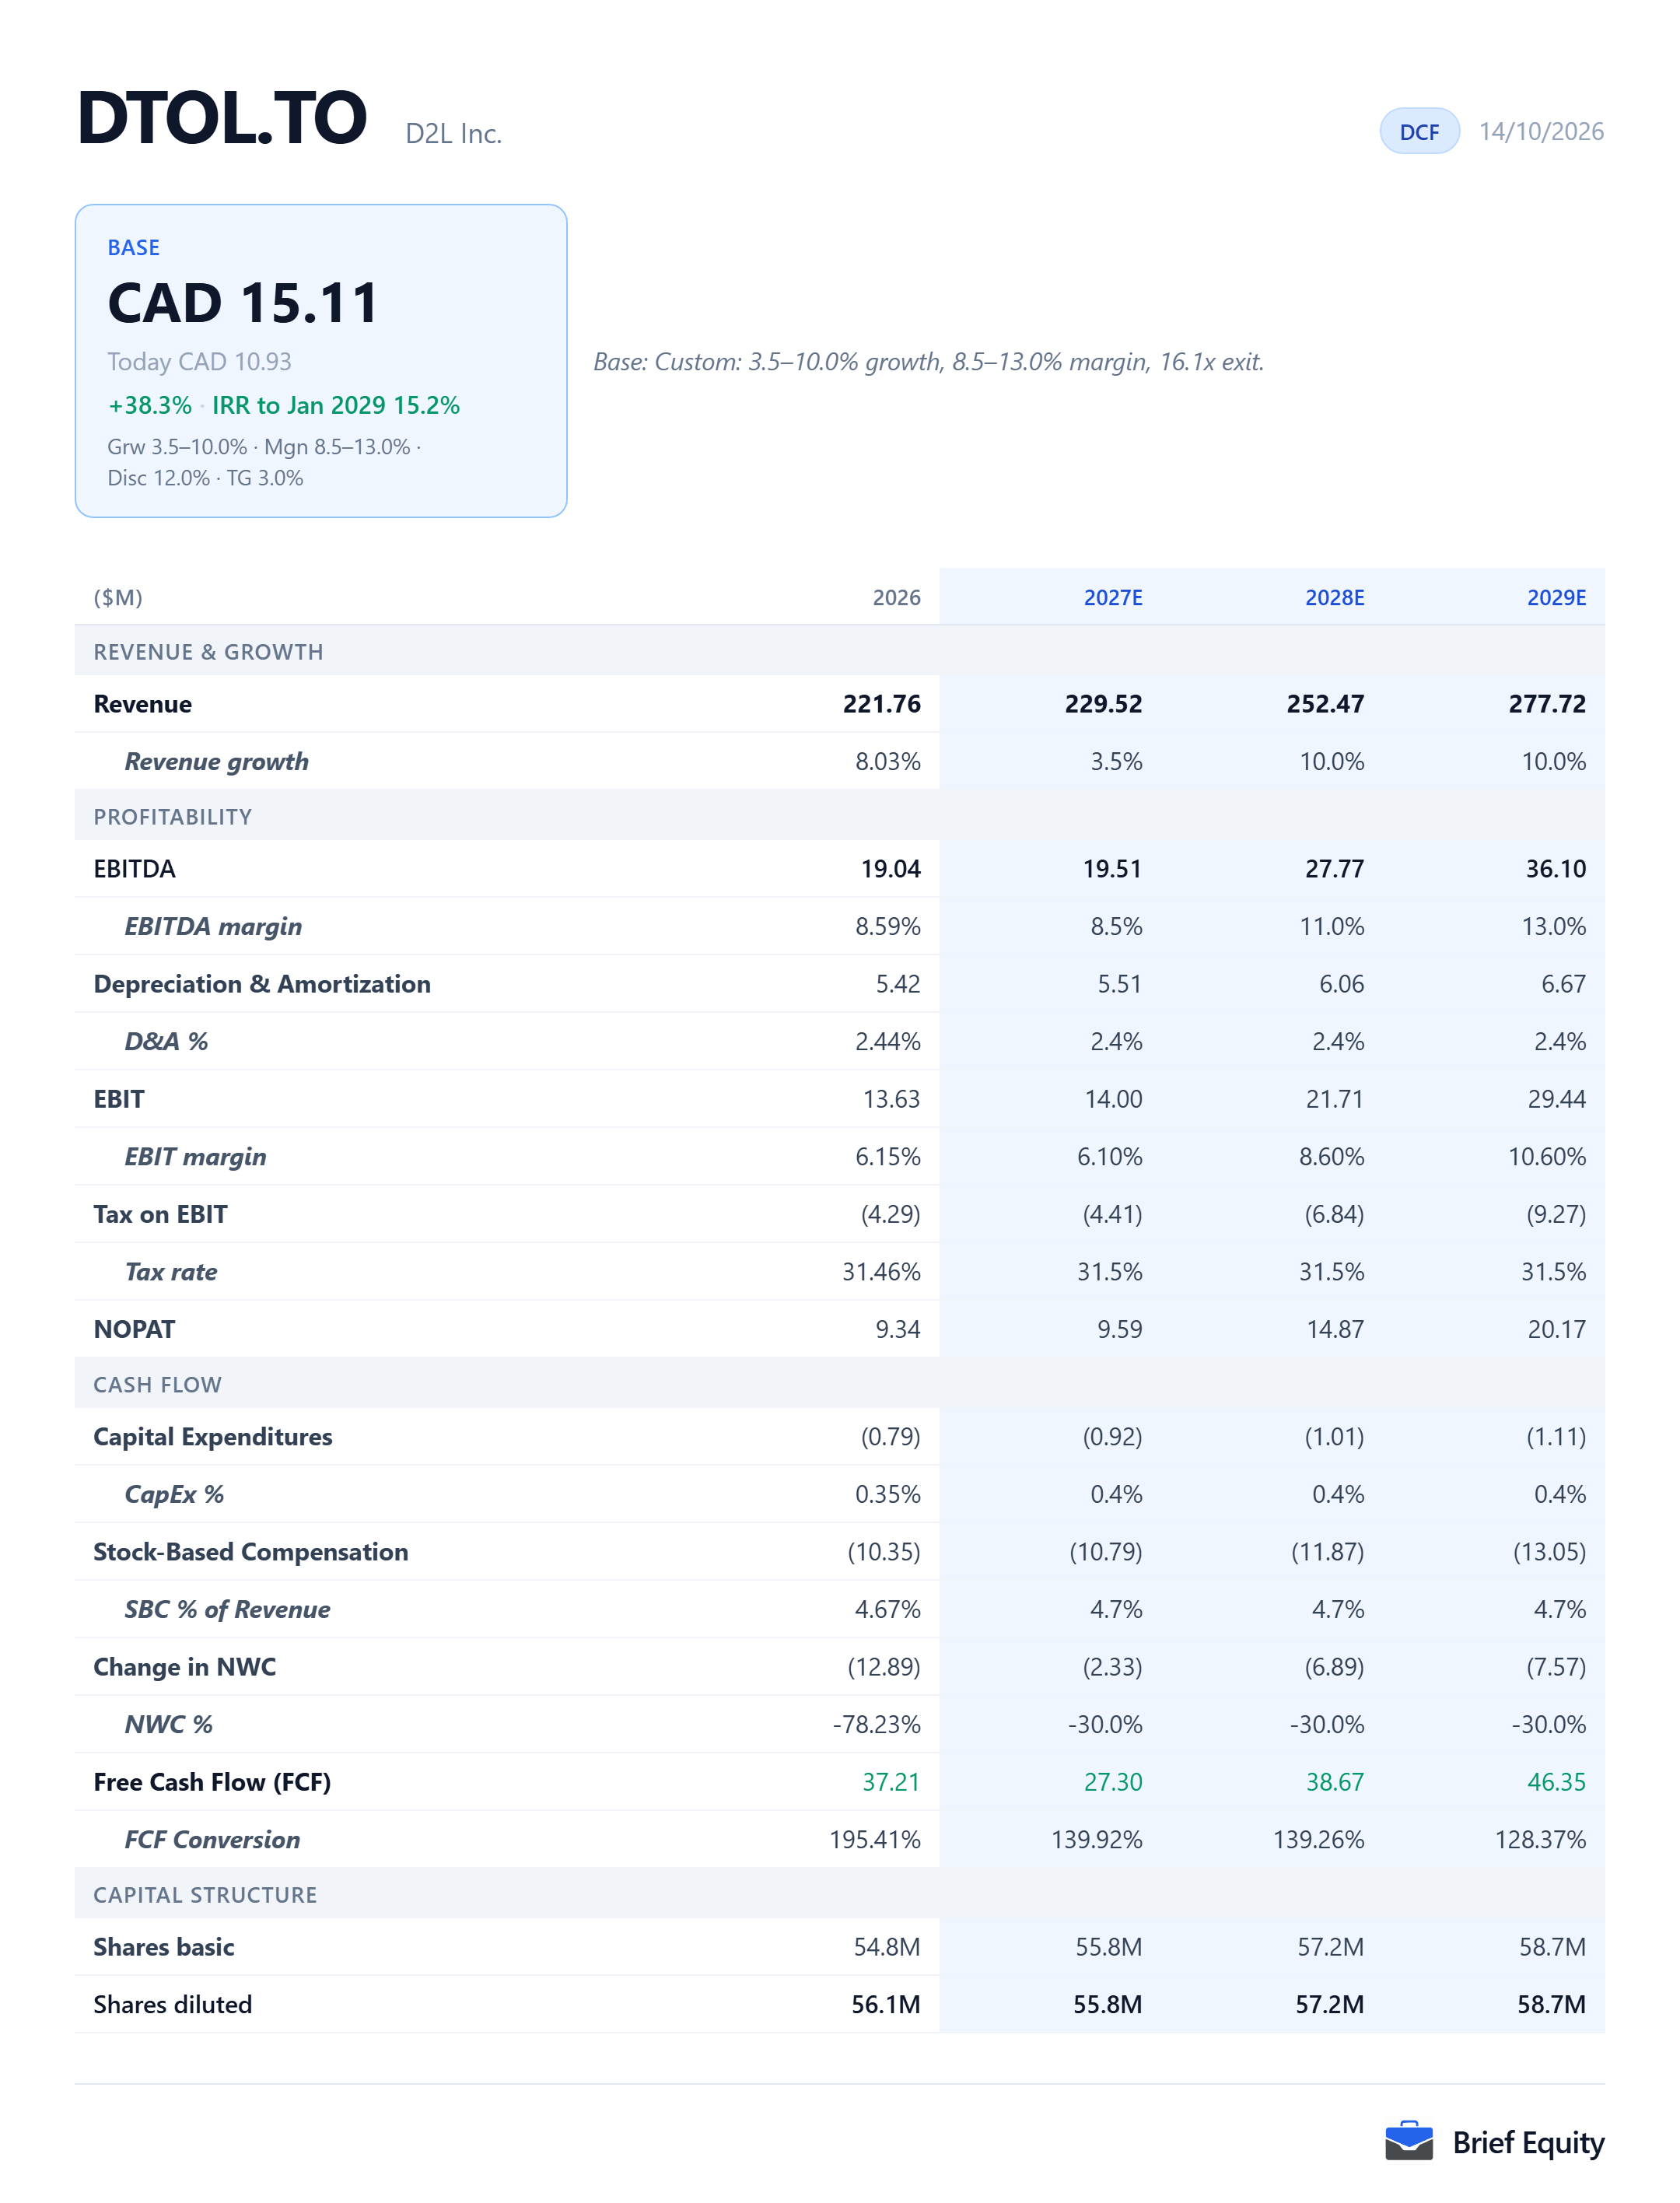
The model's assumptions for D2L
D2L's fiscal 2027 is the year ending January 31, 2027. D2L reports in US dollars while its shares are priced in Canadian dollars, so the table below is in US dollars and the value per share is in Canadian dollars. The figures come from a quick model, built on a small set of stated assumptions and projected over three fiscal years.
Reports in USD. Price and per-share values in CAD at 1.4251.
| Fiscal 2027 | Fiscal 2028 | Fiscal 2029 | |
|---|---|---|---|
| Revenue, model | 229.52 | 252.47 | 277.72 |
| Revenue growth, model | 3.5% | 10.0% | 10.0% |
| EBITDA, model | 19.51 | 27.77 | 36.10 |
| EBITDA margin, model | 8.5% | 11.0% | 13.0% |
| Free cash flow, model | 27.30 | 38.67 | 46.35 |
Why D2L looks undervalued
D2L's shares look somewhat undervalued at CAD 10.93, though not by a wide margin after the company's results over the past few quarters.
D2L's shares closed at CAD 16.90 at the end of November 2025 and fell as low as CAD 7.15 in March 2026, a period that included the sell-off in software shares that CNBC called the SaaS-pocalypse. The two largest one-day falls between December 2025 and April 2026 came on the days after D2L's own results: on December 11, 2025, after the company flagged the loss of United States K-12 customers, and on April 2, 2026, after an outlook for fiscal 2027 that came in below expectations. The shares have recovered slowly since then.
Outside the K-12 market, D2L's annual recurring revenue has grown at double-digit rates for four consecutive quarters, and those markets account for more than 90% of revenue. The company's chief financial officer said that the second quarter of fiscal 2027 brought the last and largest part of the K-12 customer losses.
“Q2 was the final tranche, and as we articulated the data points in an earlier question, was the largest batch.”
Josh Huff, Chief Financial Officer, D2L fiscal 2027 second-quarter earnings call, September 10, 2026
In the model, revenue reaches USD 229.52 million in fiscal 2027, inside the company's outlook of USD 228 million to USD 231 million, and then grows 10% a year. That rate is the bottom of the company's own target of 10% to 15% revenue growth for fiscal 2028, and above the 8% that CIBC models for that year. On those assumptions the model values the shares at CAD 15 today. Holding the rest of the model constant, the share price at the model's date corresponds to revenue falling 1.0% a year.
D2L lowered its revenue outlook for fiscal 2027 in September 2026, CIBC lowered its rating on the shares to neutral, and the company's chief financial officer said that reaching the fiscal 2028 targets requires a meaningful step-up.
“Looking beyond the current year, our fiscal 2028 target operating model remains unchanged. We continue to target revenue growth of 10%-15% and an adjusted EBITDA margin of 18%-20%. We recognize that achieving these targets requires a meaningful step-up from our fiscal 2027 performance to date.”
Josh Huff, Chief Financial Officer, D2L fiscal 2027 second-quarter earnings call, September 10, 2026
On artificial intelligence, OpenAI and Google both released tools in August 2026 that let students create their own quizzes and flashcards. D2L's own AI product, D2L Lumi, also produces flashcards and knowledge checks, and it passed USD 5 million of annual recurring revenue in the second quarter of fiscal 2027, against total annual recurring revenue of USD 223.4 million.
What has to be true, and what would break it
The estimate for D2L holds only if the conditions below are met, and each of them can fail.
What has to be true
- Revenue reaches the company's outlook of USD 228 million to USD 231 million in fiscal 2027.
- The K-12 customer losses end with the second quarter of fiscal 2027, as the company says.
- The business outside the K-12 market keeps growing about 10% a year, and that growth shows in reported revenue in fiscal 2028 and fiscal 2029.
- The model's EBITDA margin rises from 8.5% in fiscal 2027 to 13.0% in fiscal 2029.
What would break it
- Growth outside the K-12 market slows, and revenue grows by about the 8% that CIBC models for fiscal 2028.
- More large customers leave at renewal.
- AI tools for students take the place of the features D2L charges for.
- The margin stays flat while the company invests in growth.
The parts of D2L's business
D2L reports its revenue in two parts. The table gives each part's share of D2L's revenue in fiscal 2026.
| Share of revenue | |
|---|---|
| Subscription and support | 91.2% |
| Professional services and other | 8.8% |
D2L beside its peers
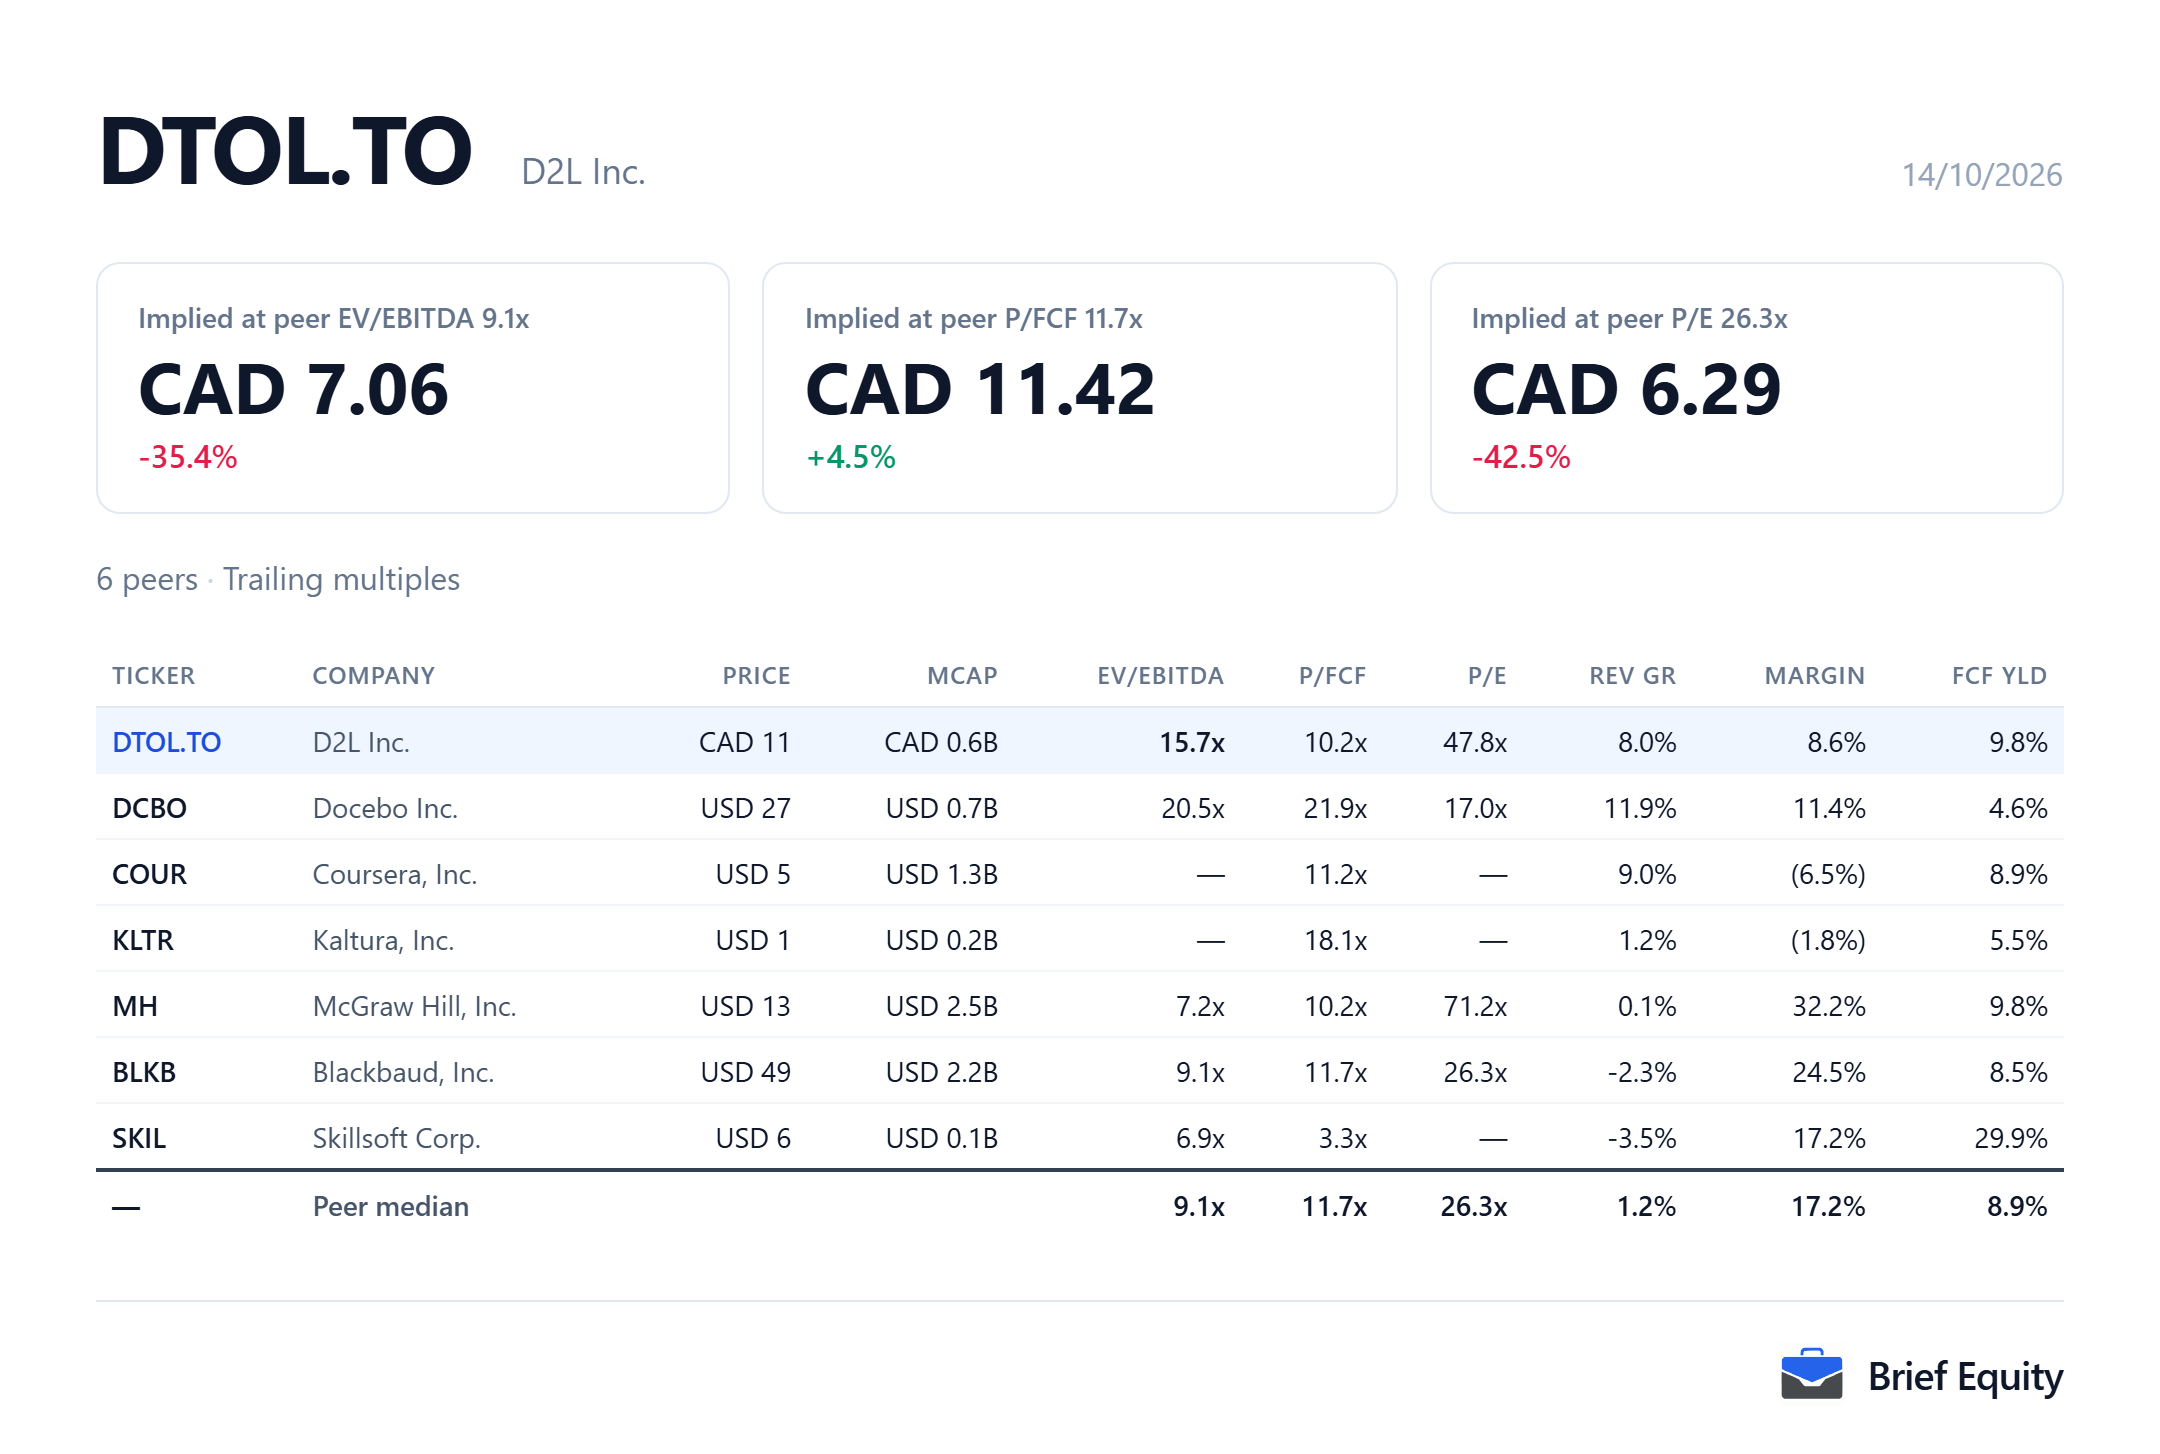
D2L is compared with six companies that sell learning software or learning services to universities, schools and employers.
- DCBO: a learning platform for employers
- COUR: online learning sold to universities and companies
- KLTR: video software sold to universities alongside the learning platform
- MH: digital learning for higher education and K-12
- BLKB: subscription software for schools
- SKIL: learning for employers
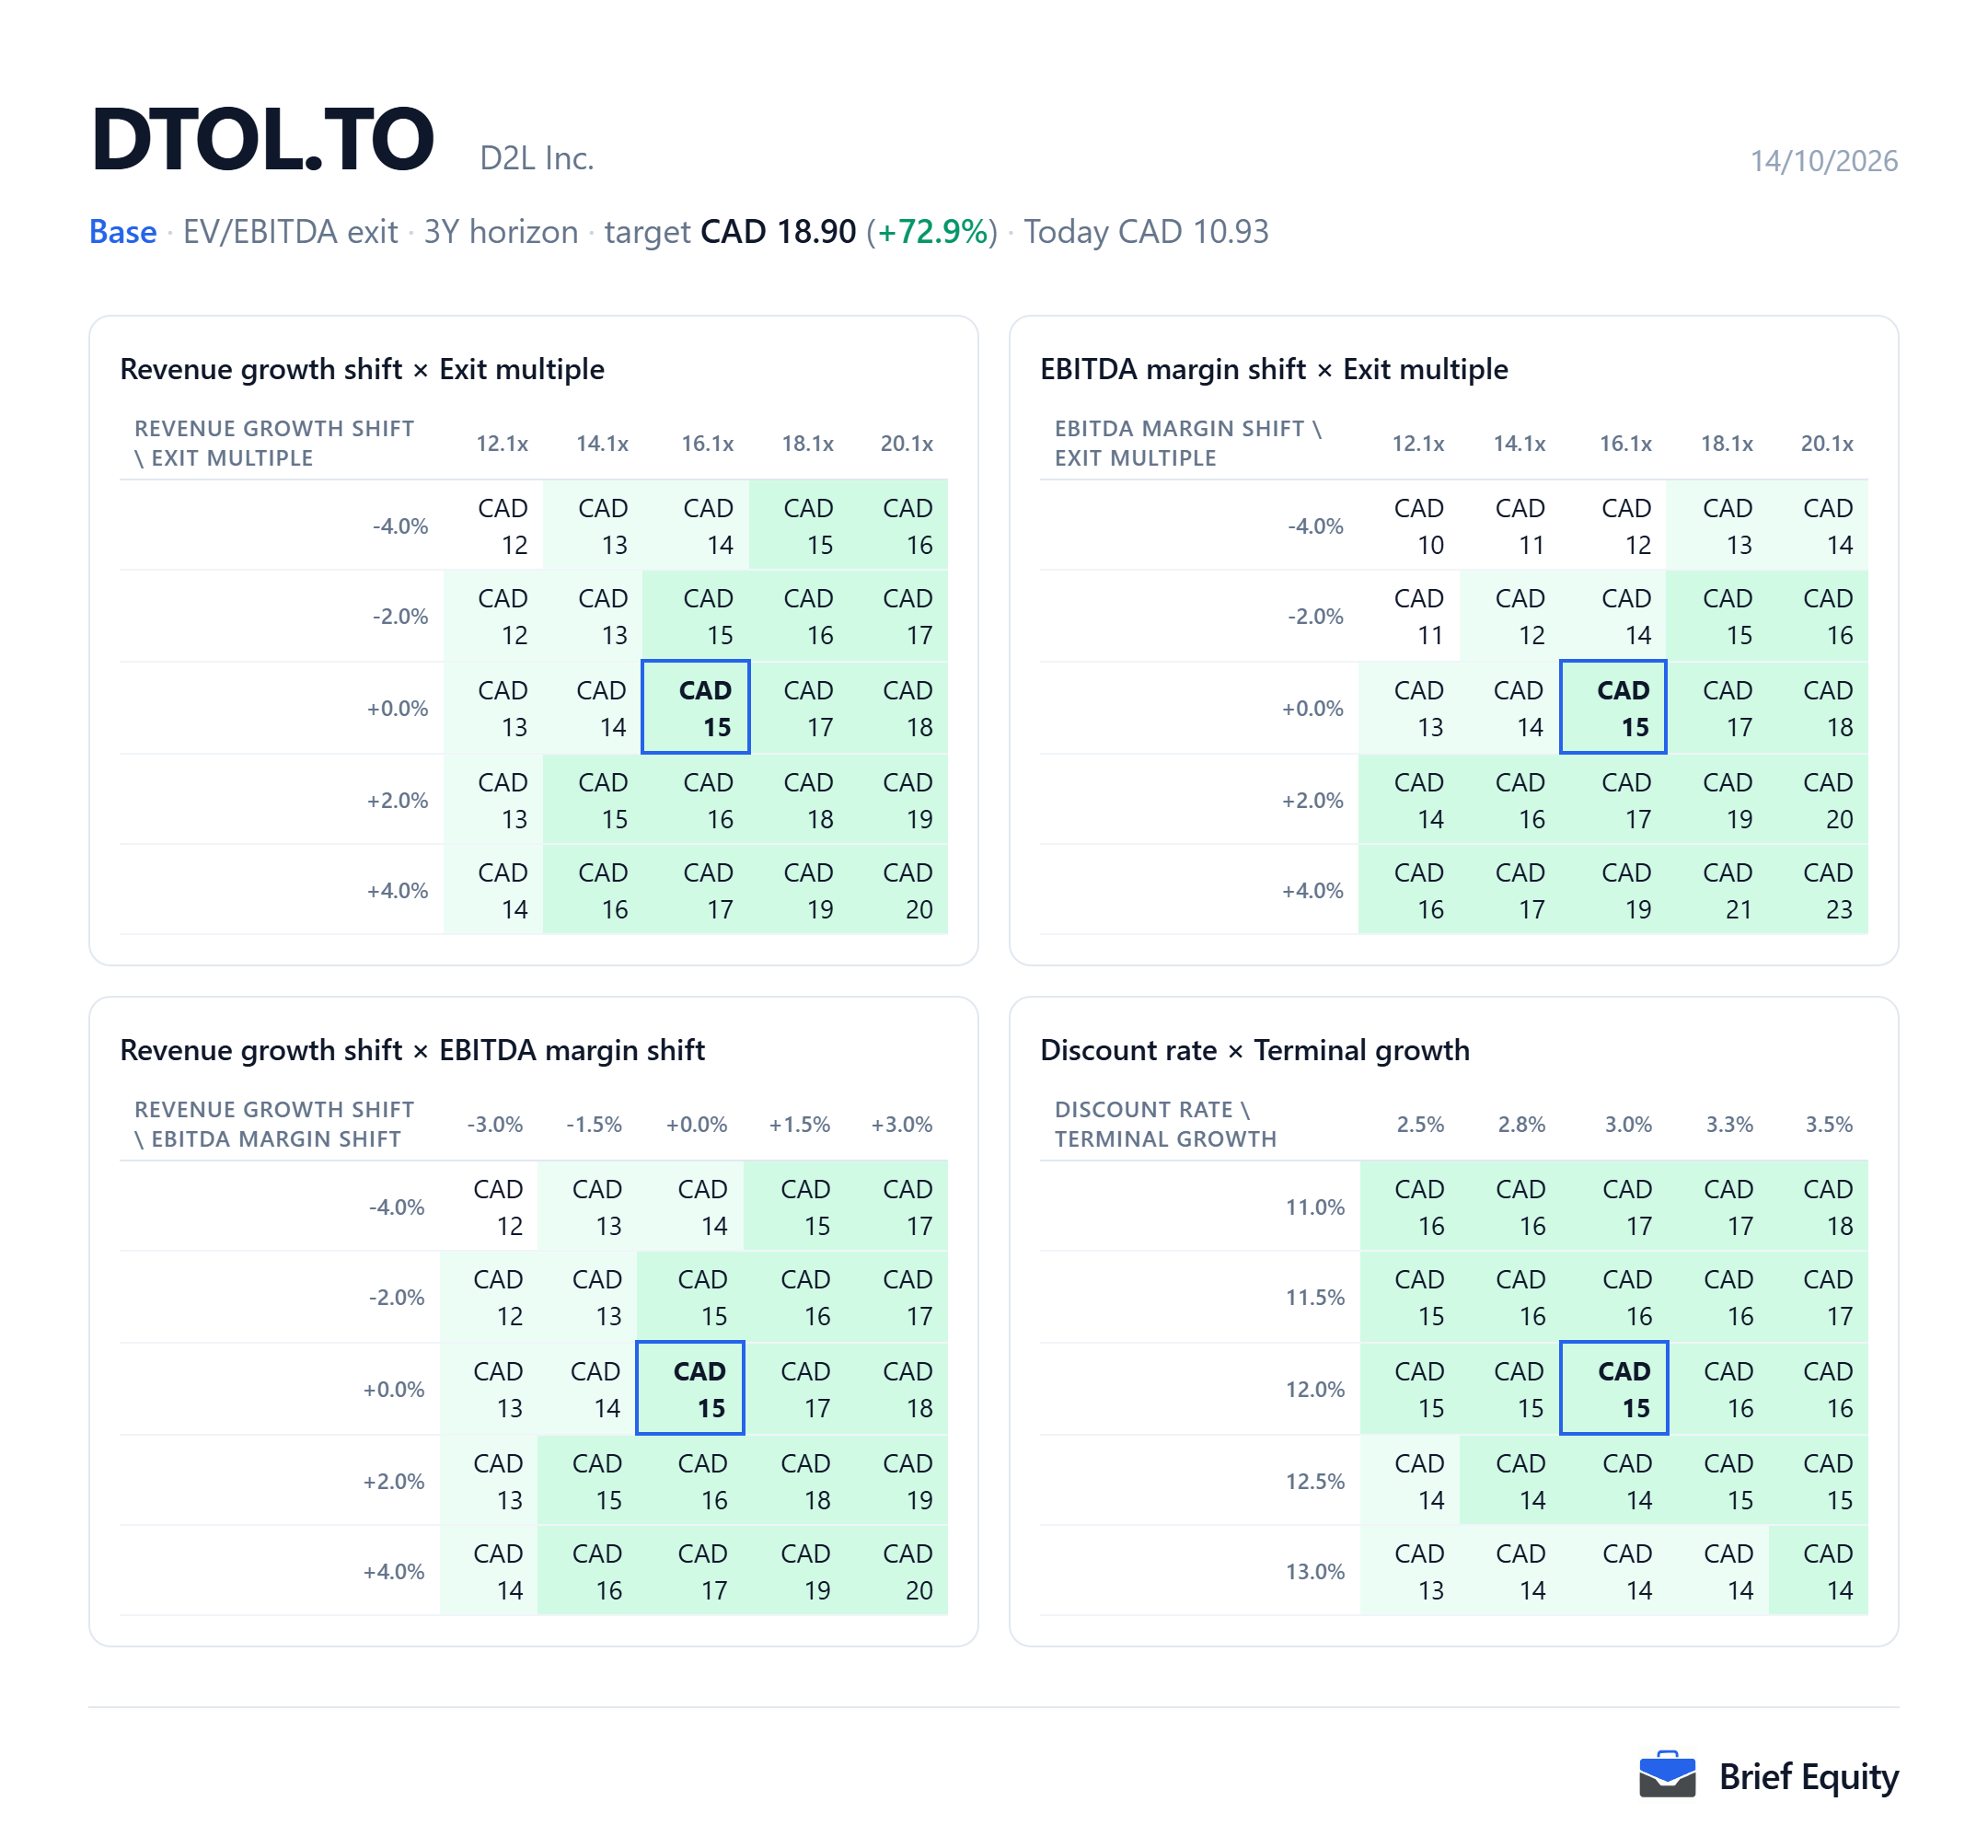
How the estimate moves with its assumptions
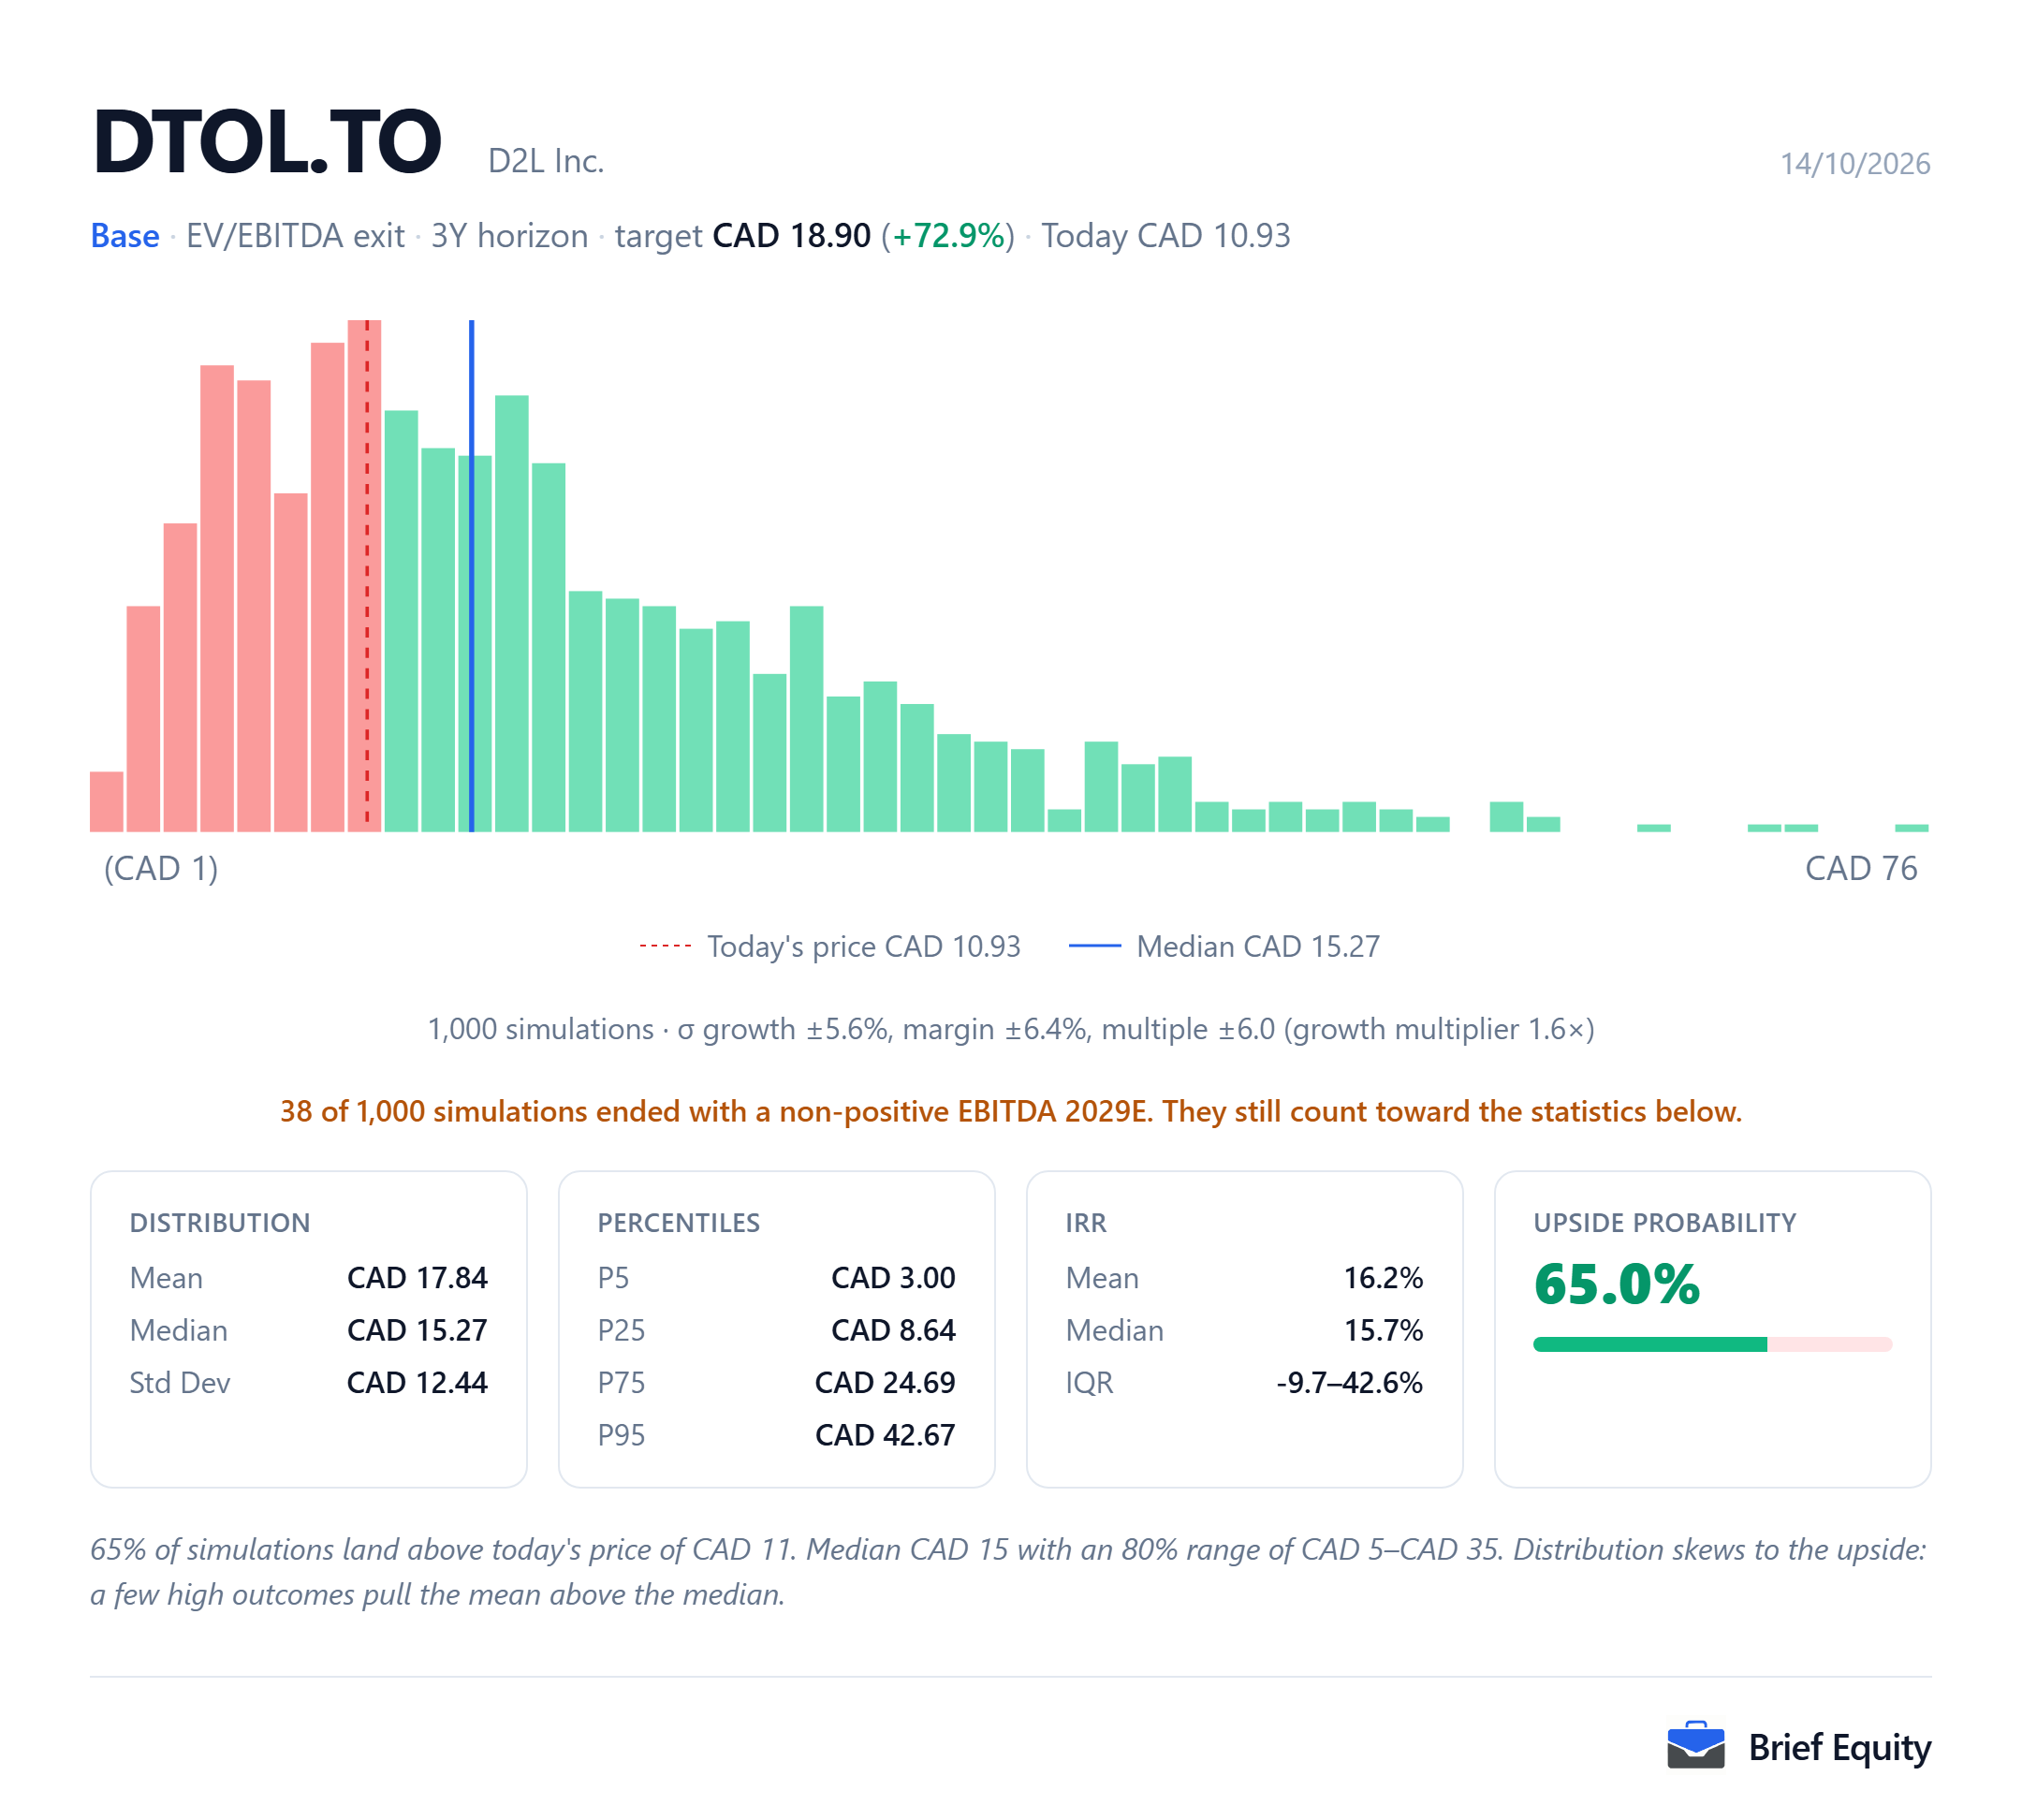
The estimate for D2L depends on its assumptions, and the two pictures below show how far it moves when they change. The first varies two assumptions at a time. The second runs the model many times with growth, margin and the exit multiple varied at random.
Questions about D2L
These questions about D2L (DTOL.TO) are answered from the documents listed under Sources.
- Does D2L have debt?
- D2L reported cash and cash equivalents of USD 106.4 million and no debt at July 31, 2026.
- How many shares has D2L bought back?
- In the twelve months ended July 31, 2026, D2L repurchased and cancelled 3,059,762 Subordinate Voting Shares, 11.2% of the Subordinate Voting Shares outstanding at the start of that period.
- Who controls D2L?
- As a group, D2L's directors and executive officers owned or controlled 52.00% of its shares and approximately 91.31% of the votes, according to its annual information form for fiscal 2026.
Sources
The quotations and facts about D2L (DTOL.TO) on this page rest on the documents below.
- D2L second-quarter fiscal 2027 earnings release, September 9, 2026
- D2L fiscal 2027 second-quarter earnings call, September 10, 2026
- D2L fourth-quarter and fiscal 2026 earnings release, April 1, 2026
- D2L annual information form, fiscal 2026, April 1, 2026
- D2L third-quarter fiscal 2026 earnings release, December 10, 2025
- Monthly share prices for D2L, October 14, 2026
- Daily share prices for D2L, December 2025 to April 2026, October 14, 2026
- CNBC, Tech Download: the software sell-off, February 27, 2026
- The Globe and Mail, small caps to watch: D2L's second-quarter results, September 10, 2026
- The Globe and Mail, small caps to watch: D2L's fiscal 2026 results, April 1, 2026
- OpenAI, new tools for learning and teaching, August 4, 2026
- Google Workspace Updates, Gemini in Google Classroom for students of all ages, August 4, 2026
About this page
Brief Equity and its team hold no position in D2L (DTOL.TO) as of October 14, 2026.
This page is research, not investment advice. It describes one model and the assumptions behind it, and market data is delayed. Read how these models are built and our editorial policy.
Related guides: How to build a DCF model (step by step), DCF explained (discounted cash flow), How to do a comparable-companies (comps) analysis.