Valuation · EV/EBITDA model
Is Apple (AAPL) stock overvalued?
Brief Equity's quick EV/EBITDA model of Apple, dated October 11, 2026, puts the shares at about $345 for fiscal 2030, against a price of $336.64 that day. On those assumptions Apple looks somewhat expensive, with a return of about 2%. The estimate rests on one condition: that revenue growth slows sharply after an unusually strong fiscal 2026.
By The Brief Equity Team · Model dated · Published
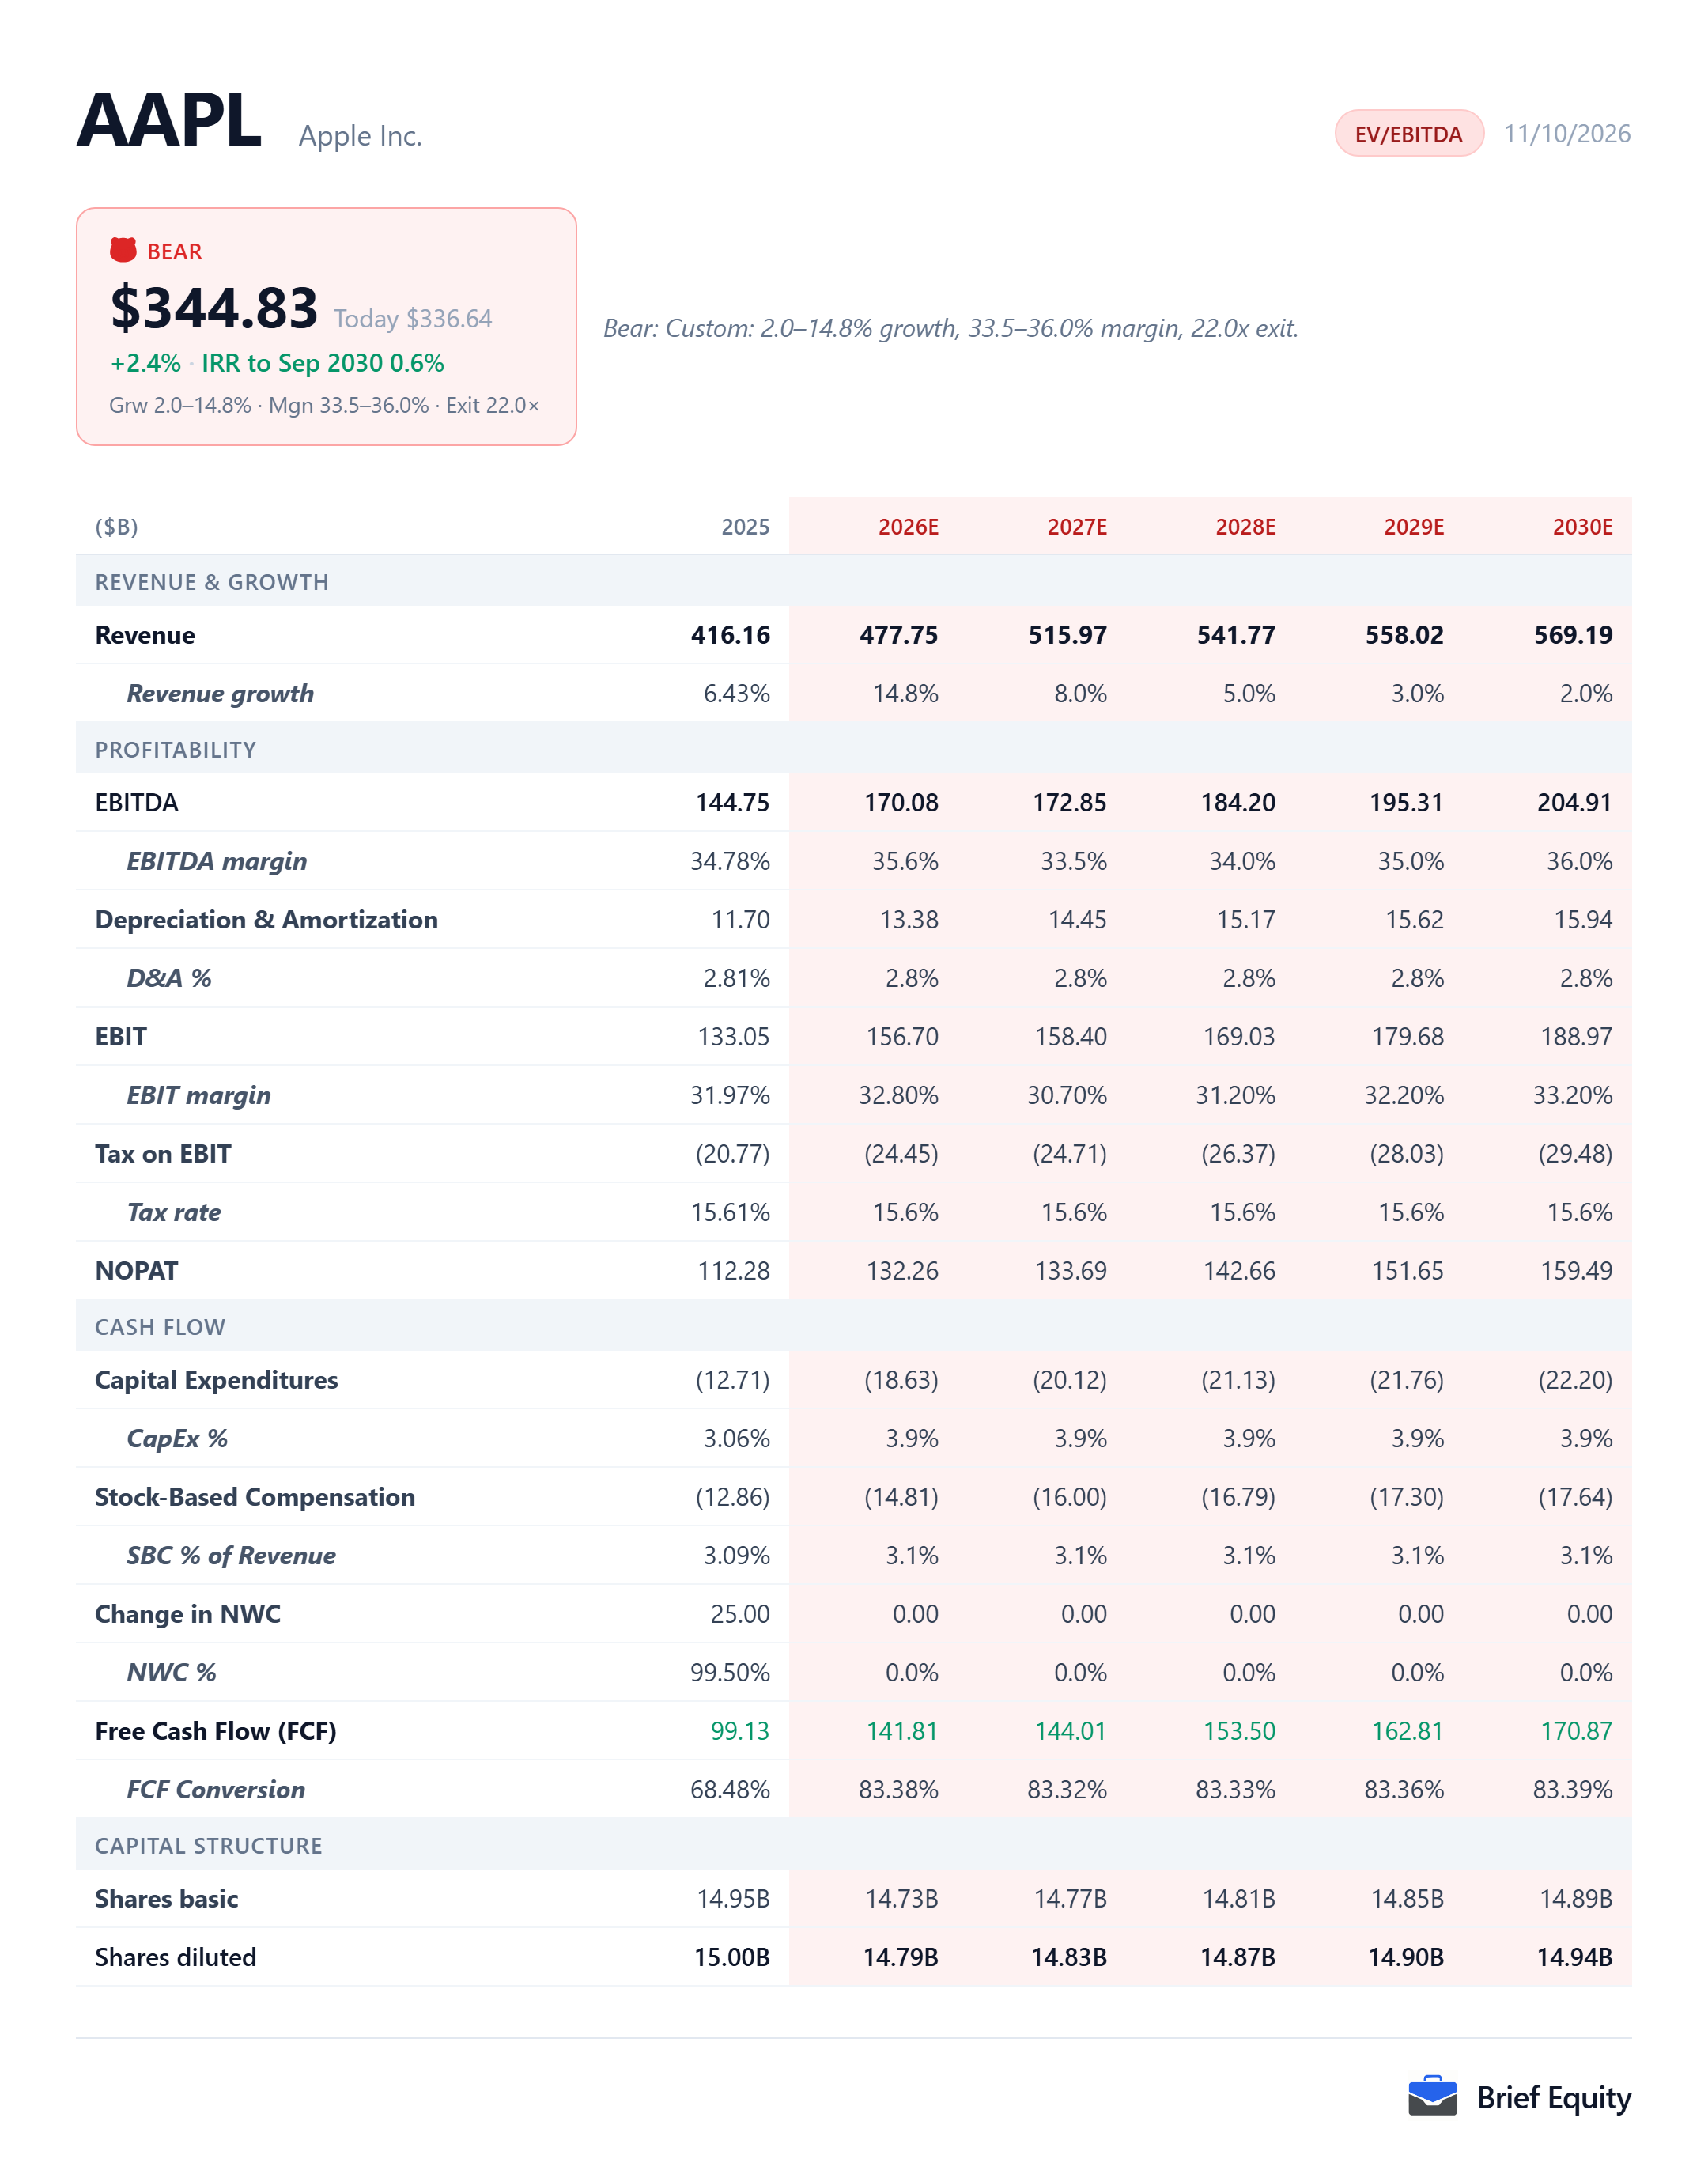
The model's assumptions for Apple
Apple's fiscal year ends in late September, so fiscal 2027 is the twelve months to September 2027. The figures below come from a quick model, built on a small set of stated assumptions and projected to fiscal 2030. Analyst consensus revenue is shown beside the model's revenue for the two years it covers.
| Fiscal 2027 | Fiscal 2028 | Fiscal 2029 | Fiscal 2030 | |
|---|---|---|---|---|
| Revenue, model | 515.97 | 541.77 | 558.02 | 569.19 |
| Revenue growth, model | 8.0% | 5.0% | 3.0% | 2.0% |
| EBITDA, model | 172.85 | 184.20 | 195.31 | 204.91 |
| EBITDA margin, model | 33.5% | 34.0% | 35.0% | 36.0% |
| Fiscal 2027 | Fiscal 2028 | |
|---|---|---|
| Revenue, model | 515.97 | 541.77 |
| Revenue, analyst consensus | 524.85 | 564.32 |
Why Apple looks overvalued
Apple looks somewhat expensive at a share price in the 330s, because the model returns little unless hardware keeps growing as it did in fiscal 2026. The model is a quick one. It has revenue growth slowing from 8.0% in fiscal 2027 to 2.0% in fiscal 2030 and values the company at 22.0 times EBITDA in that year, which gives about $345 a share, about 2% above the price on the model's date.
That slowdown resembles Apple's record before fiscal 2026. Total net sales were $394.328 billion in fiscal 2022 and $416.161 billion in fiscal 2025. iPhone net sales were $205.489 billion in fiscal 2022 and $209.586 billion in fiscal 2025.
Fiscal 2026 is the exception. iPhone net sales rose 22% over the first nine months of the year, and Apple attributes the increase mainly to higher sales of Pro models. Analysts still expect revenue growth of 9.9% in fiscal 2027 and 7.5% in fiscal 2028, so the model's growth is below consensus in both years.
Apple's margin comes under pressure first in the model, which has the EBITDA margin falling to 33.5% in fiscal 2027. On the July 2026 earnings call the chief financial officer put gross margin at 49.3% in the March quarter and 48.1% in the June quarter once tariff refunds are excluded. Research and development expense rose 33% over the first nine months of fiscal 2026, with investments in artificial intelligence among the reasons Apple gives.
“If you look beyond September, we see the market pricing for memory continuing to increase, which could drive an increasing impact on our business, and we're continuing to evaluate this.”
Tim Cook, Chief Executive Officer, Apple fiscal 2026 third-quarter earnings call, July 30, 2026
The model then has the EBITDA margin rising to 36.0% by fiscal 2030, on the growth of Services. Services was 26.2% of Apple's net sales in fiscal 2025 and carried a gross margin of 75.4%, against 36.8% for Products. Apple's total gross margin was 43.3% in fiscal 2022 and 46.9% in fiscal 2025, while the Products gross margin was 36.3% and 36.8% in the same two years.
Apple's growth could continue. Net sales in Greater China fell 4% in fiscal 2025 and rose 30% over the first nine months of fiscal 2026.
What has to be true, and what would break it
Apple looks expensive on this model only if a few things hold, and the view fails if they do not.
What has to be true
- Revenue growth slows after fiscal 2026 toward the pace of fiscal 2022 to fiscal 2025.
- Memory costs and spending on artificial intelligence hold the margin down in fiscal 2027 and fiscal 2028.
- A multiple of 22 times EBITDA is what investors pay in fiscal 2030 for a company whose revenue grows 2% to 3% a year.
What would break it
- Demand for Pro models and the recovery in Greater China continue beyond fiscal 2026.
- Services grows fast enough to lift the margin earlier than the model assumes.
- Investors pay more than 22 times EBITDA for Apple in fiscal 2030.
The parts of Apple's business
Apple reports net sales in five categories, and the two largest behave differently: iPhone is half of net sales, while Services contributed about half of the growth in fiscal 2025.
| Share of revenue | Share of revenue growth | |
|---|---|---|
| iPhone | 50.4% | 33.4% |
| Services | 26.2% | 51.7% |
| Wearables, Home and Accessories | 8.6% | |
| Mac | 8.1% | 14.8% |
| iPad | 6.7% | 5.3% |
Apple beside its peers
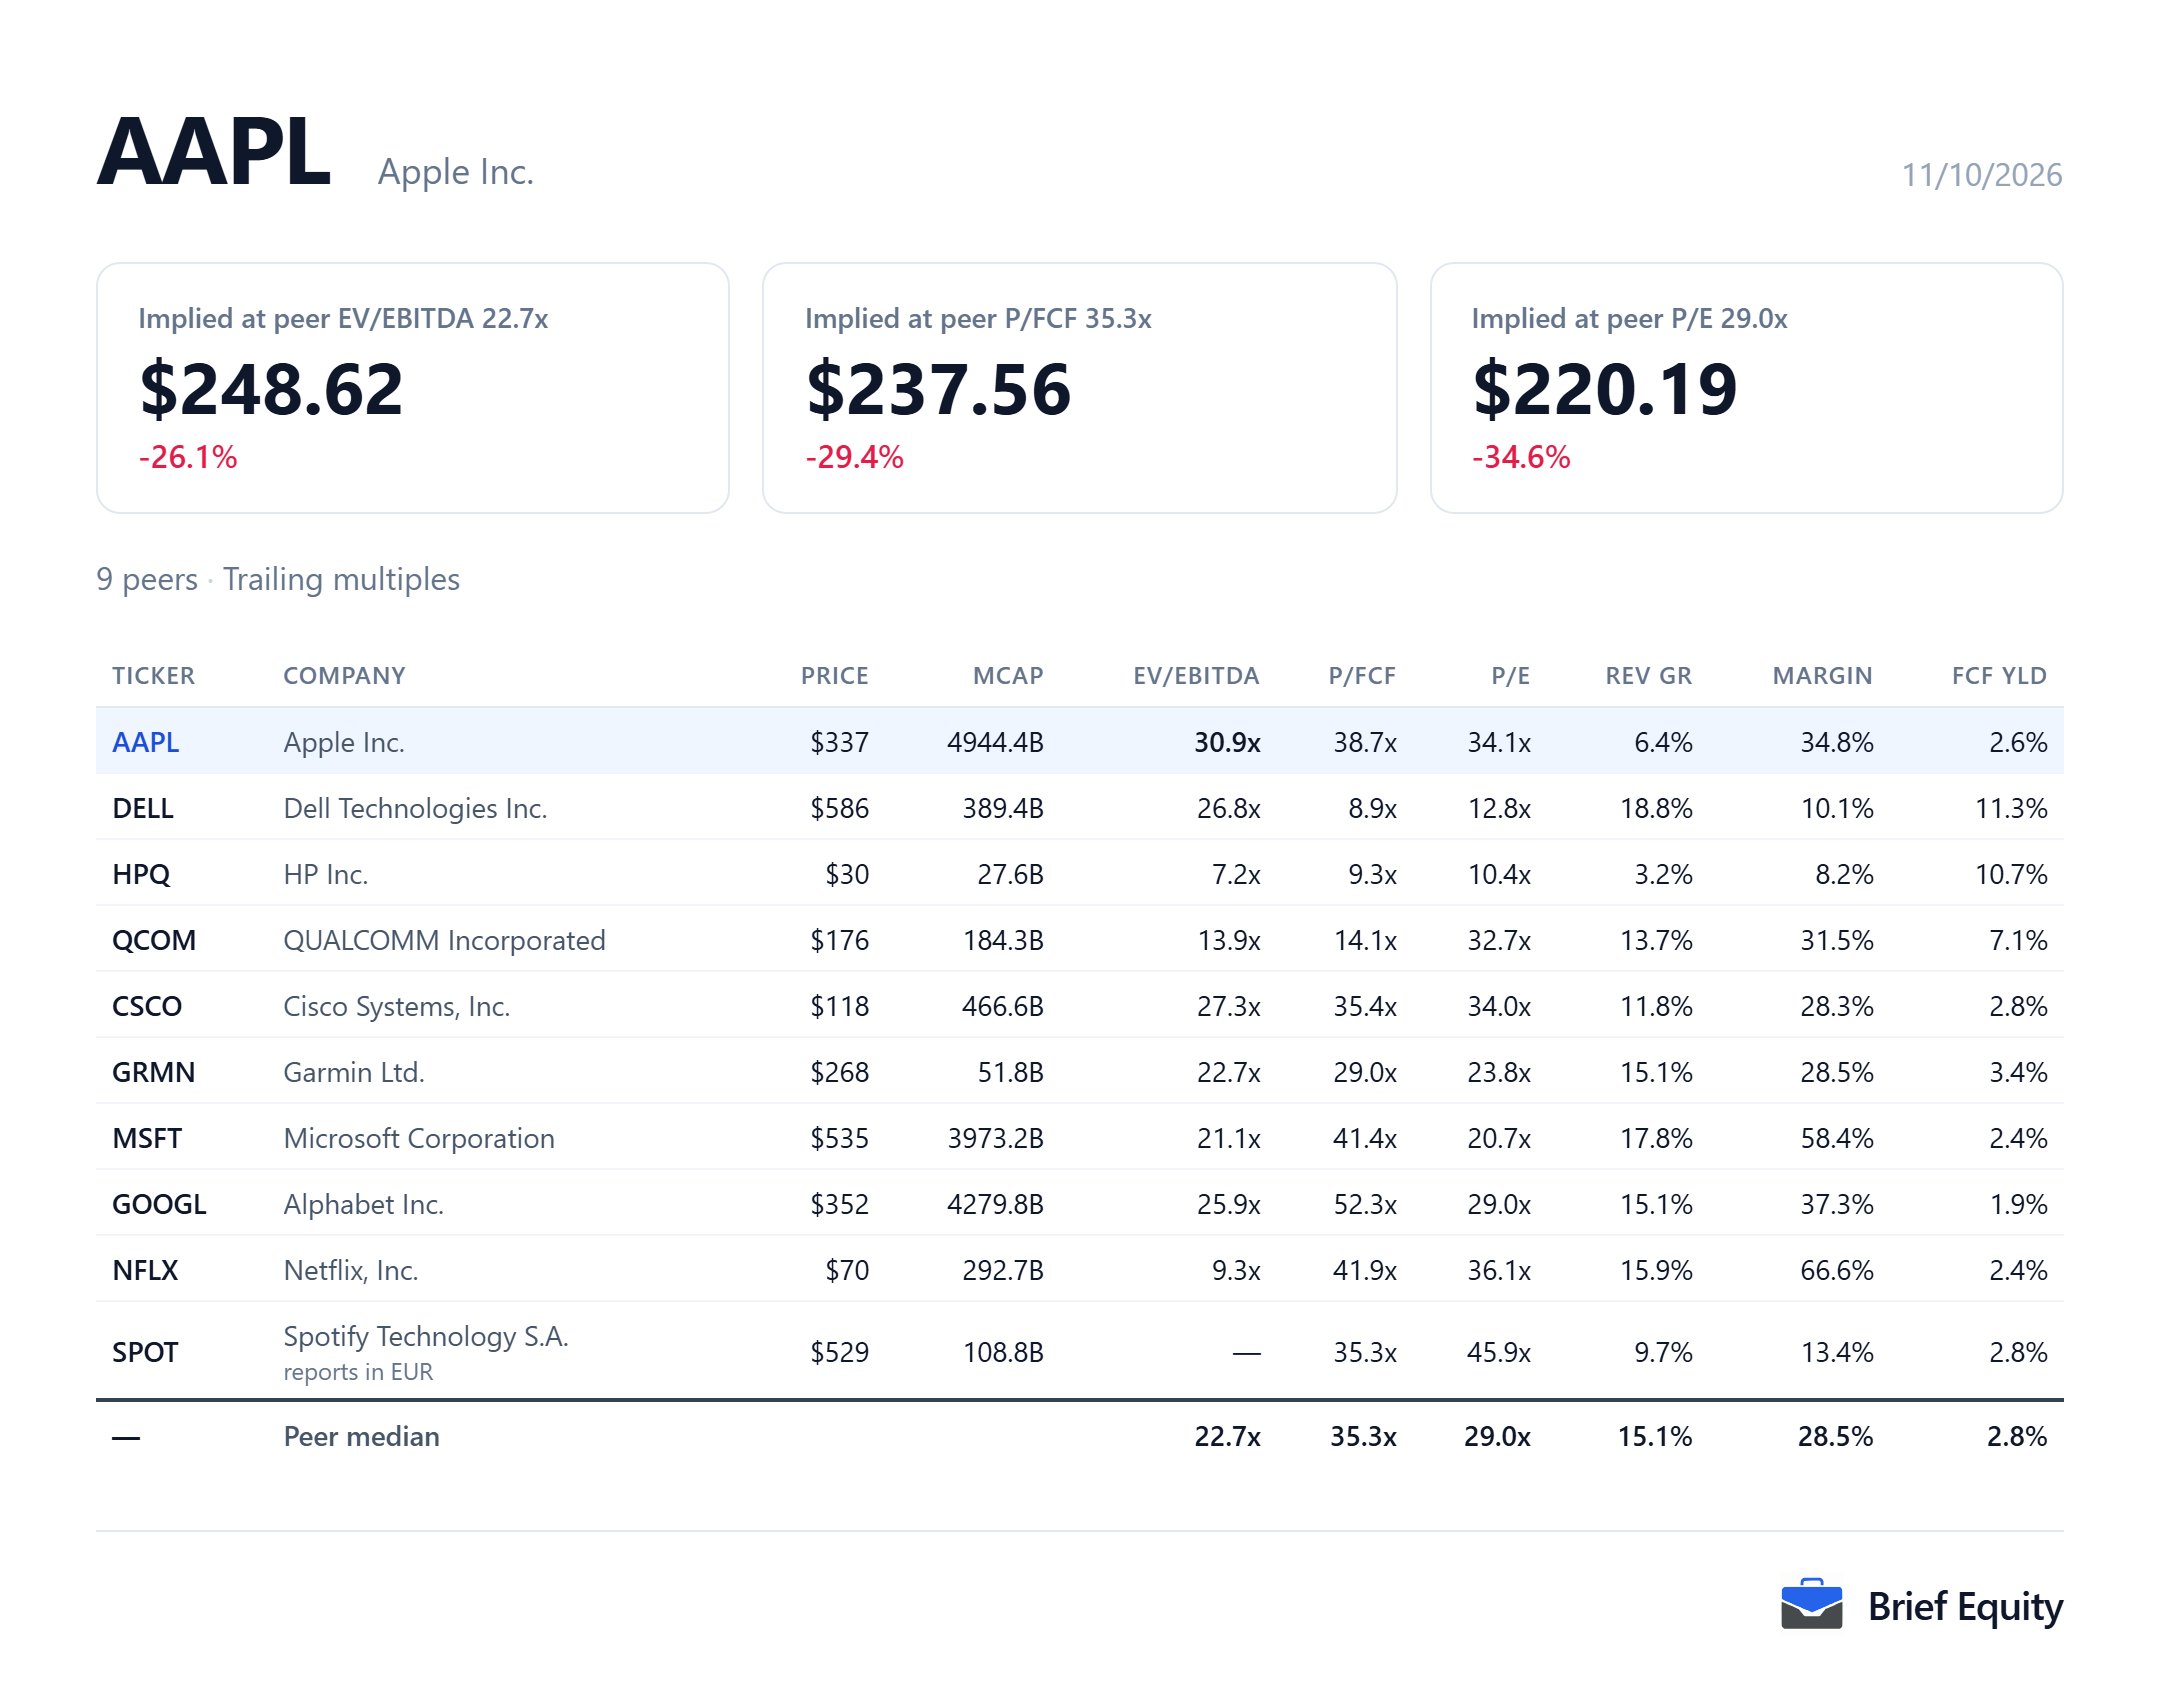
Apple is compared here with nine companies, chosen to cover both its hardware and its services.
- DELL: Mature PC and device hardware
- HPQ: Mature PC and device hardware
- QCOM: Mature large-cap hardware and chips
- CSCO: Mature large-cap hardware and chips
- GRMN: Wearables
- MSFT: Platform and services at a similar scale
- GOOGL: Platform and services at a similar scale
- NFLX: Paid subscriptions
- SPOT: Paid subscriptions
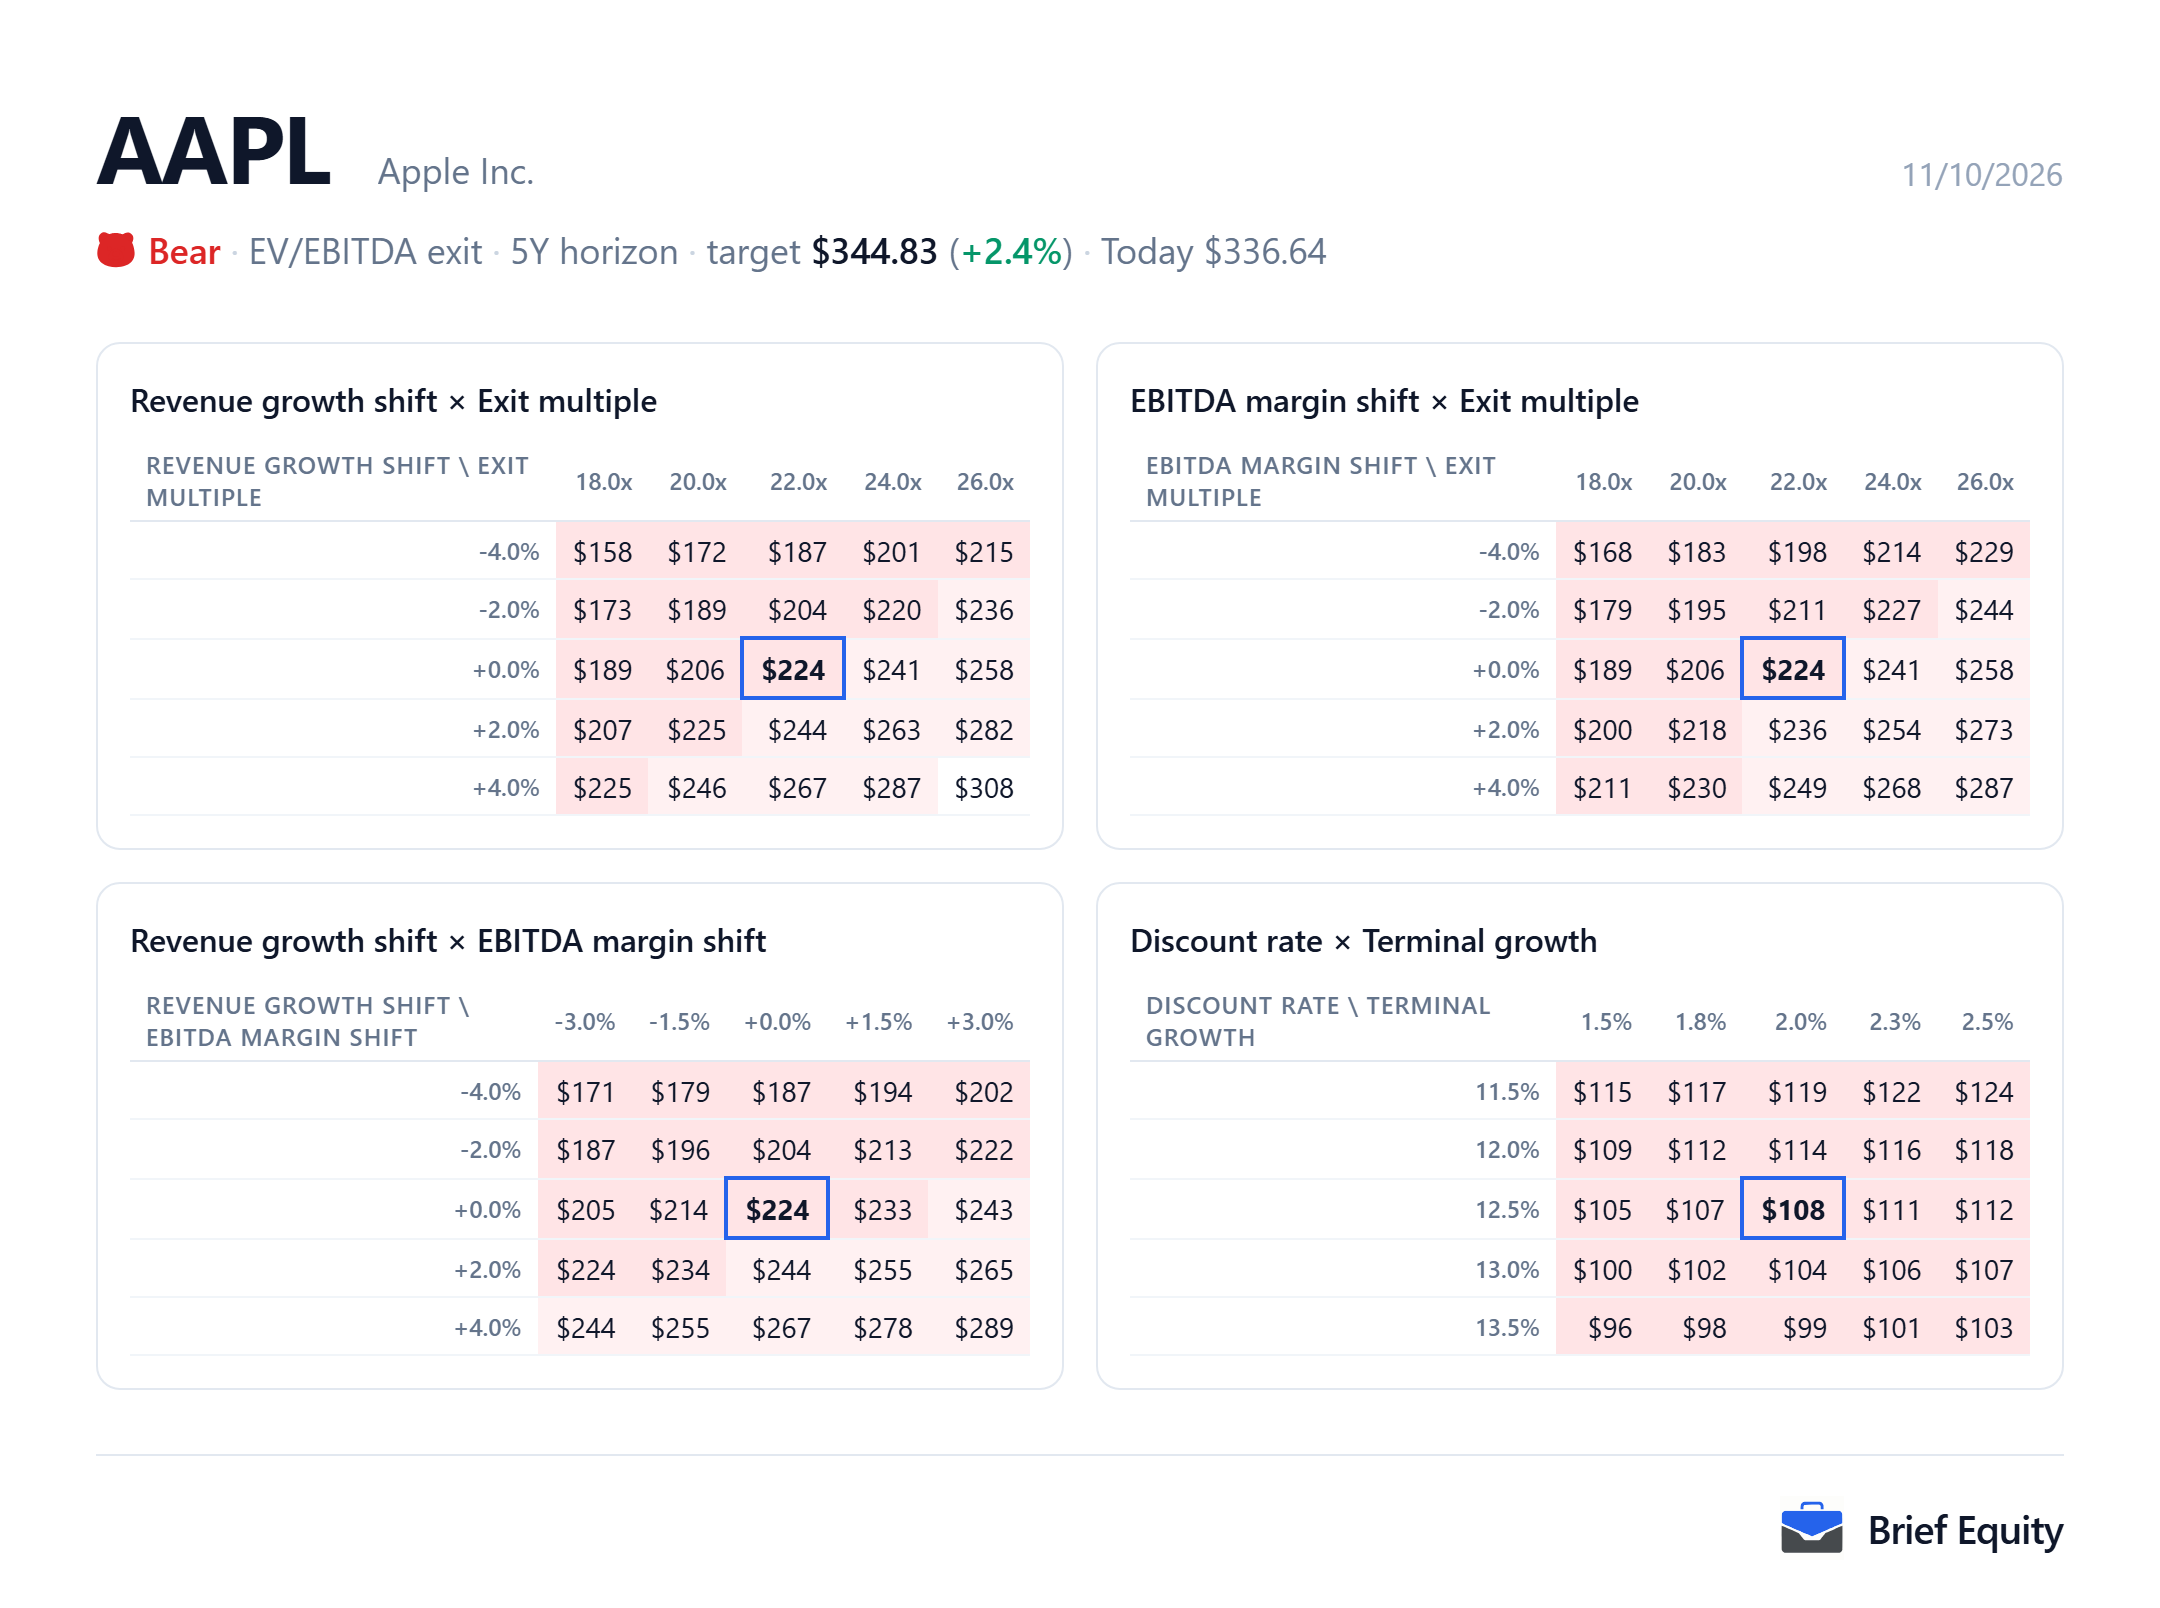
How the estimate moves with its assumptions
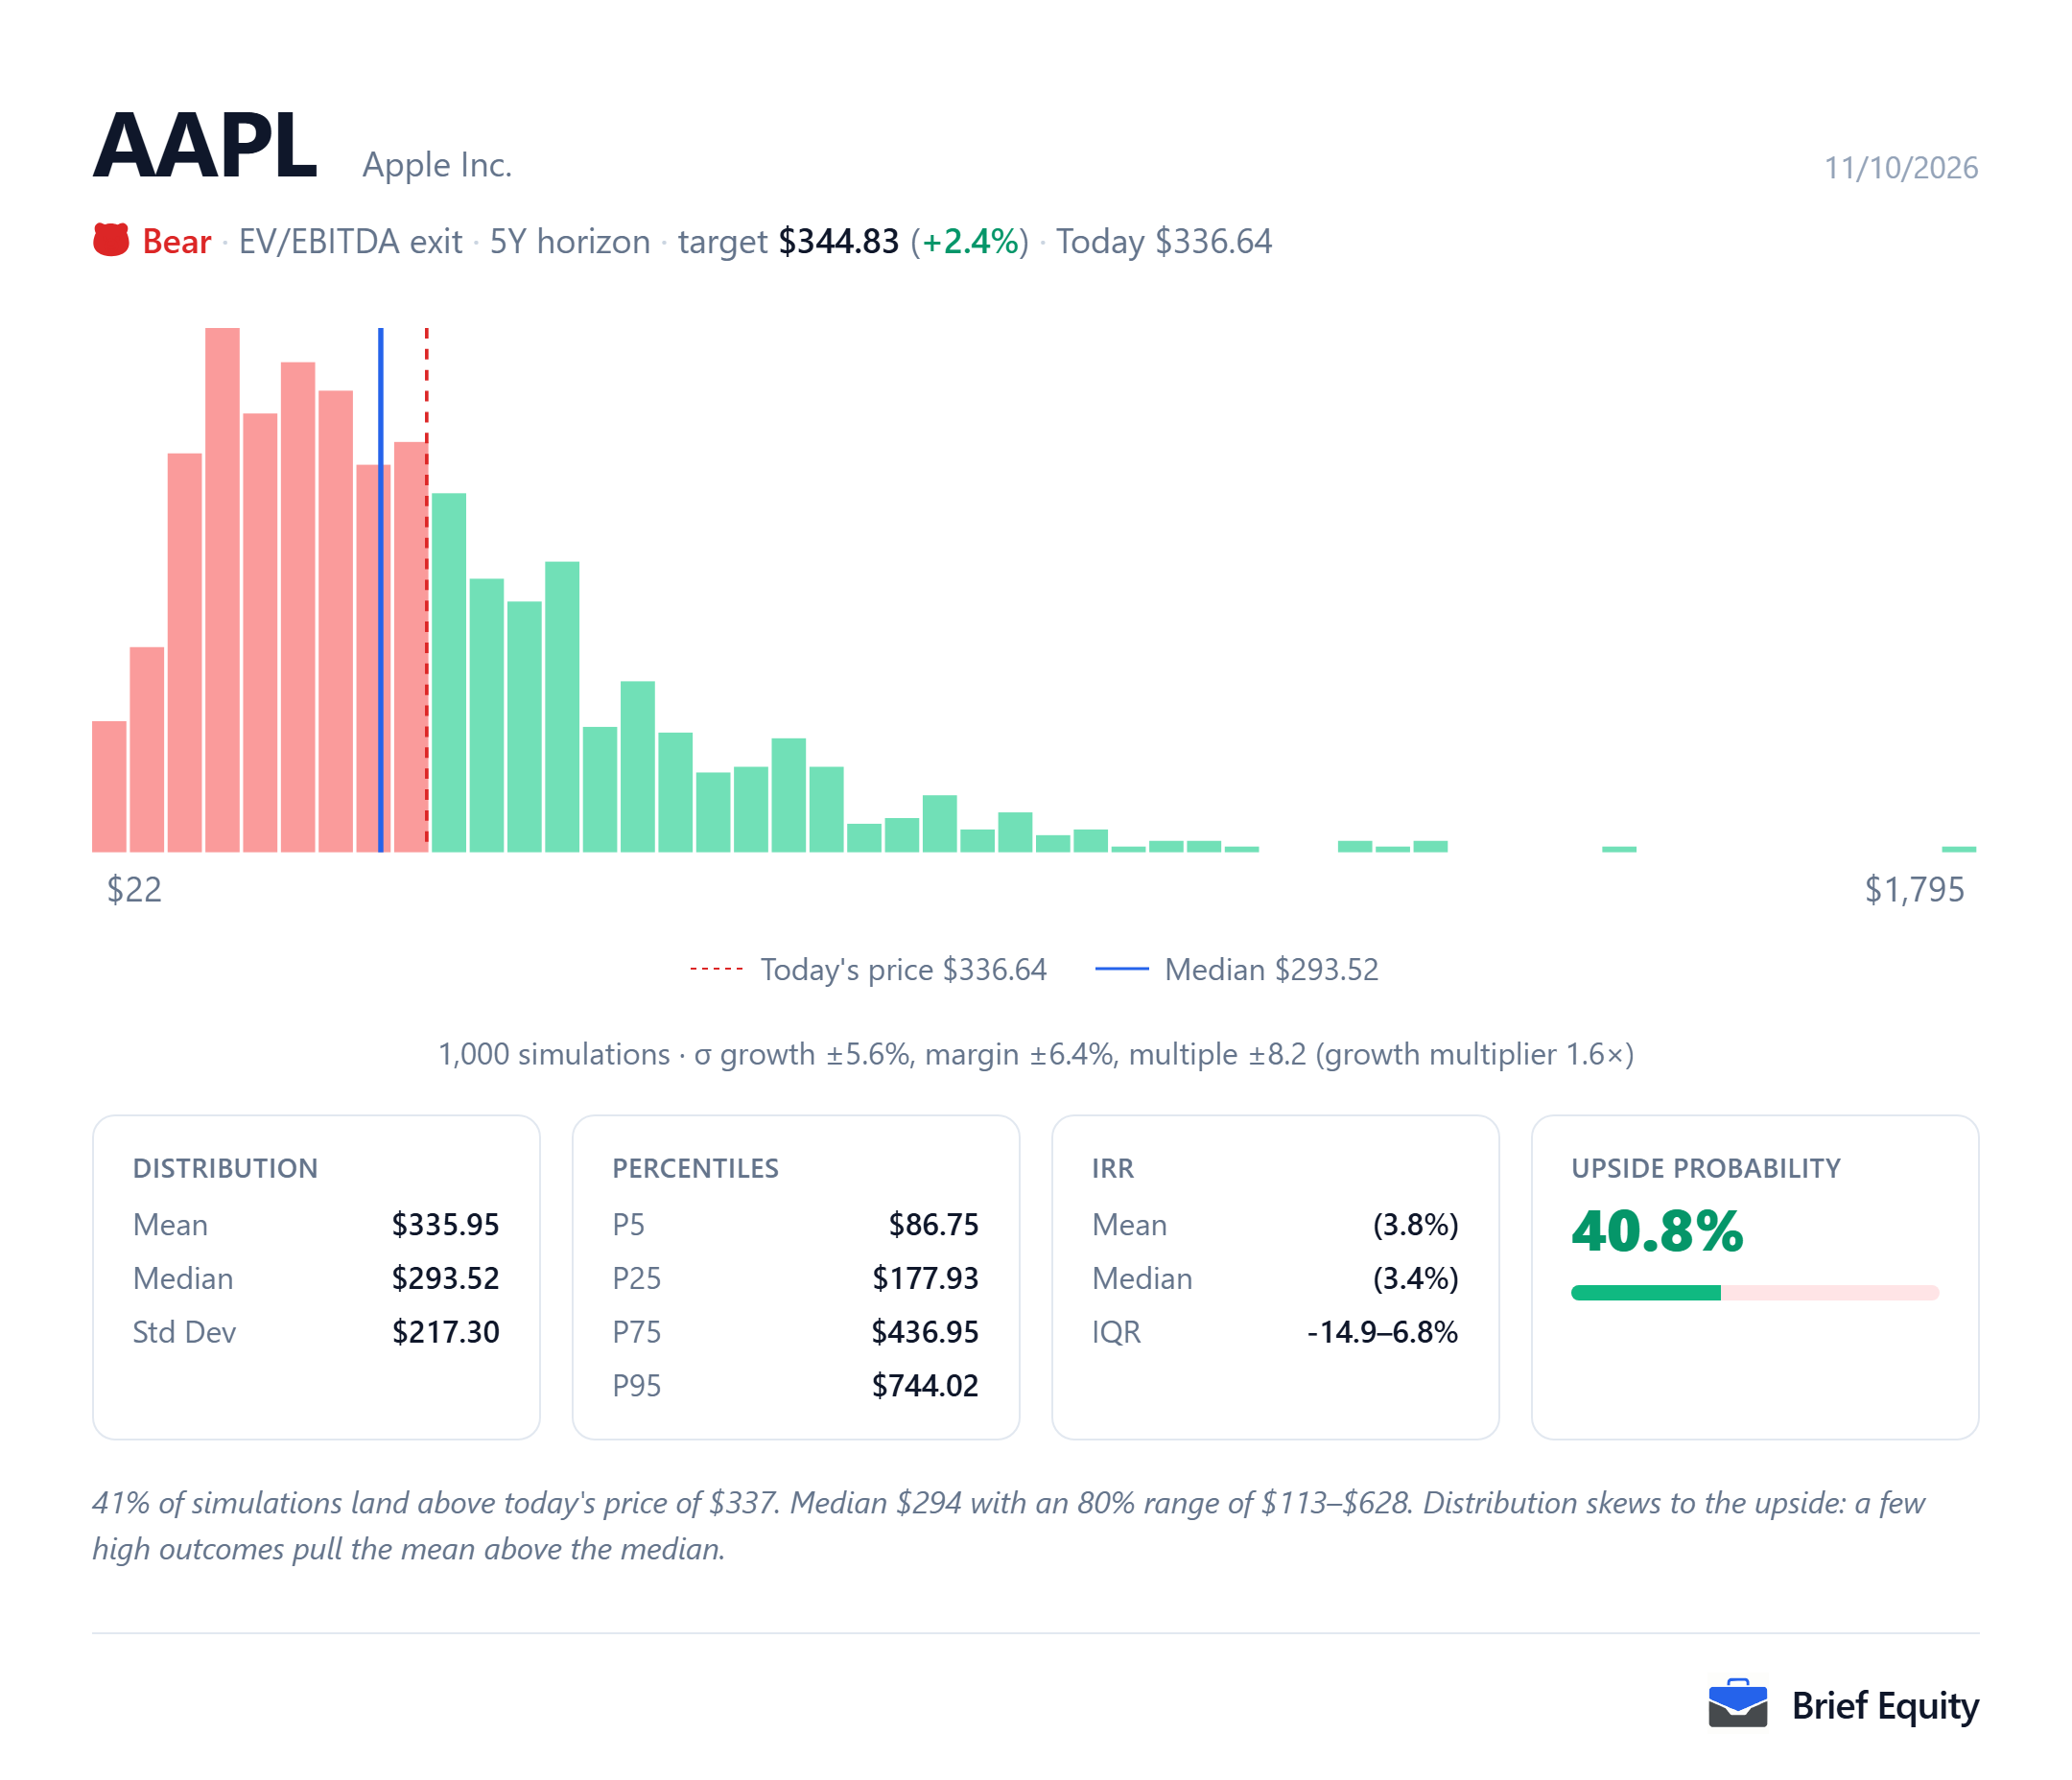
The estimate for Apple depends on its assumptions, and the two pictures below show how far it moves when they change. The first varies two assumptions at a time. The second runs the model many times with growth, margin and the exit multiple varied at random.
Questions about Apple
These questions about Apple (AAPL) are answered from the documents listed under Sources.
- When does Apple's fiscal year end?
- Apple's fiscal year ends on the last Saturday of September, so fiscal 2025 ended on September 27, 2025.
- How many shares did Apple buy back in fiscal 2026?
- Apple repurchased 215 million shares for $61.8 billion in the nine months ended June 27, 2026.
- How much cash and debt does Apple have?
- Apple ended the June 2026 quarter with $147 billion in cash and marketable securities and $84 billion in total debt.
Sources
The quotations and facts about Apple (AAPL) on this page rest on the documents below.
- Apple annual report (Form 10-K) for fiscal 2025, October 31, 2025
- Apple annual report (Form 10-K) for fiscal 2024, November 1, 2024
- Apple quarterly report (Form 10-Q) for the quarter ended June 27, 2026, July 31, 2026
- Apple fiscal 2026 third-quarter earnings call, July 30, 2026
About this page
Brief Equity and its team hold no position in Apple (AAPL) as of October 11, 2026.
This page is research, not investment advice. It describes one model and the assumptions behind it, and market data is delayed. Read how these models are built and our editorial policy.
Related guides: EV/EBITDA explained, How to do a comparable-companies (comps) analysis, How to build a DCF model (step by step).