How the model workspace works
Click a number on the picture to see that part of a model at work.
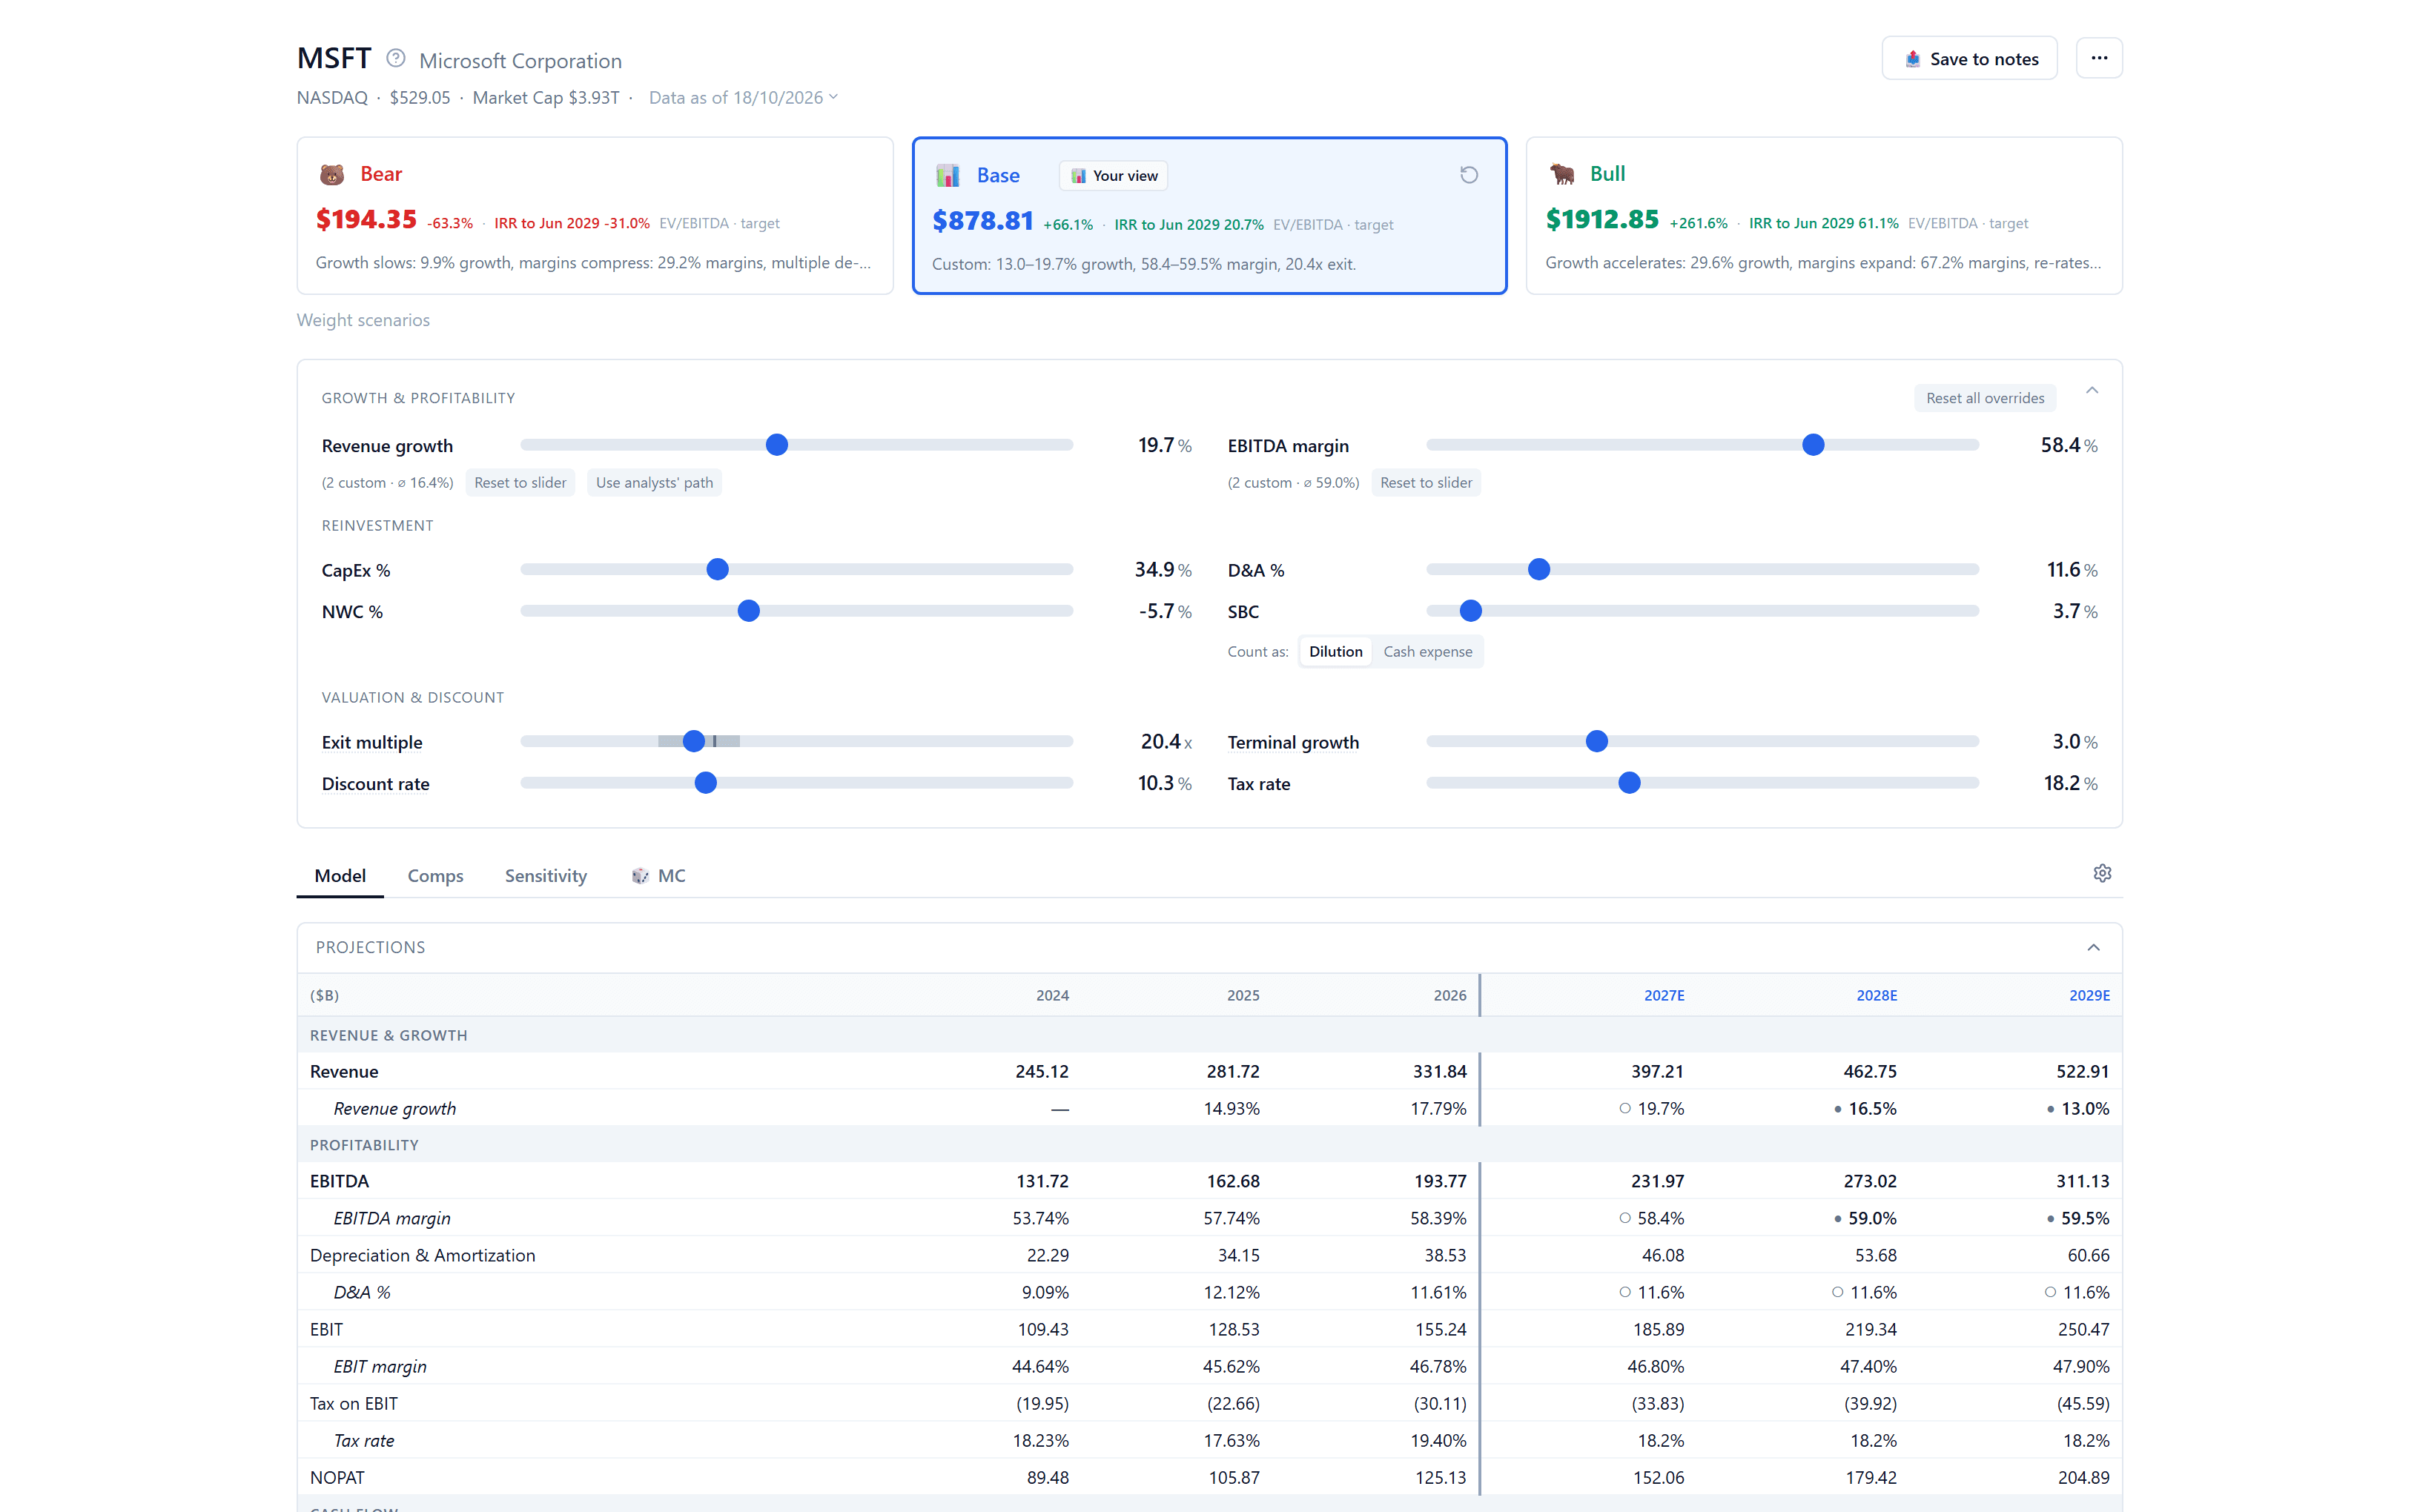
The header
The stock, the exchange it trades on, its price and market cap, and the day the data was read. Click the market cap or the date to see where they come from.
The stock, the exchange it trades on, its price and market cap, and the day the data was read. Click the market cap or the date to see where they come from.
Three versions of one company. Base starts on analysts' numbers, and the weights blend all three into one target.
Drag a slider and every value moves with it. Type over any year in the table, and the slider counts the years you set yourself.
Model holds the projection and both values. Comps, Sensitivity and MC test the answer against peers, against two assumptions at once, and against random runs.
Value the exit on EBITDA, revenue or EBIT, put the DCF on the cards instead, and project three or five years. The same panel sets basic or diluted shares and the units and decimals the numbers print in.
Click any figure to see the steps behind it, with the real numbers in each step.
Save any part of the model to your notes as a dated snapshot, linked back to the model.
The exact rules
This is a 3- or 5-year exit-multiple + DCF model. The inputs you control: Revenue growth, EBITDA margin, CapEx %, D&A %, NWC %, SBC, Exit multiple, Terminal growth, Discount rate, Tax rate, and your own adjustments and share count in the per-share math panel. Click any number on the workspace to see how it was computed.
FCF (Free Cash Flow)
Unlevered free cash flow (FCFF), the cash the whole business generates before financing: EBIT − tax on EBIT + D&A + (SBC added back under the Dilution treatment) − CapEx − change in NWC. Loss years pay zero tax (no refund) but the loss still reduces cash flow. No interest is deducted from FCF: the DCF counts debt once, in net cash, and only the exit target charges interest, as its own step (see Exit valuation). Under the Cash expense treatment SBC stays expensed inside EBIT and is neither added back nor deducted again. Historical years always add SBC back.
EBITDA
Operating income plus the depreciation and amortization reported on the cash-flow statement. The same definition is used in the model's history, in the comps and in the charts, so interest income and investment gains never sit inside it.
Discount rate
The blend of what shareholders and lenders require, cost of equity (risk-free rate + beta × equity risk premium) blended with the after-tax cost of debt at market weights. Click the Discount rate label for the recipe: every ingredient is visible and editable there. Must exceed terminal growth.
DCF
The present value of projected FCF plus a Gordon Growth terminal value, divided by the shares of the final projected year (today's shares grown by SBC dilution), plus today's net cash and long-term investments less preferred stock and minority interest, plus or minus your adjustments, over today's shares. Discounting is fixed mid-year and runs from the date the price was read; the first projected year counts only the part that had not yet elapsed at the balance-sheet date. The DCF stays unlevered: it charges no interest, because the discount rate and the debt inside net cash already price the financing.
IRR
The compound annual return implied by today's price reaching the per-share value: (value ÷ price)^(1 ÷ years) − 1, where years runs from the date the price was read to the end of the final projected year.
Exit valuation
Apply the exit multiple to EBITDA, revenue or EBIT in the final projected year (the metric is a model setting), then add net cash in the final projected year: net cash today and long-term investments less preferred stock and minority interest, plus or minus your adjustments, plus the projected FCF with the first year counting only its unelapsed part, less the interest the company pays net of the interest it earns, after tax and held at the latest fiscal year's level, so a company that is adding debt will pay more than the model charges. Divide by that year's shares, grown by SBC dilution (each year's rate capped at 30%). This is the target. The card also shows a value today, which stays unlevered and charges no interest: projected cash flows discounted mid-year and the sale discounted from the end of the final projected year, both from the date the price was read, so it sits beside the DCF card on the same footing.
Starting multiple
The exit multiple starts at the stock's multiple on the day the model is created: enterprise value (market cap plus debt, preferred stock and minority interest, less cash and long-term investments) over the latest fiscal year's EBITDA, revenue or EBIT, rolled forward by trailing-twelve-month revenue over fiscal-year revenue. When the stock trades above its own 3Y median multiple that day, the start is scaled down by how far above it the stock trades, and never below that median, taken without long-term investments as the start is. It is never scaled down by more than the stock's EV/Sales multiple sits above its own 3Y median, so a drop in earnings alone does not lower it. A Refresh updates the figures and never changes an exit multiple.
Gordon Growth terminal value
FCF in the final projected year × (1 + terminal growth) ÷ (Discount rate − terminal growth). Requires Discount rate > terminal growth.
Reverse DCF
The sanity check behind the Market expectations card. It works back from today's price to the assumption the market implies: growth, margin, exit multiple or terminal growth. The exit multiple is solved on the exit method's value today.
SBC treatment
Stock-based compensation is counted as EITHER Dilution (grows the share count; the expense is added back to FCF) OR Cash expense (stays inside EBIT; shares flat), never both.
Dilution
Under the Dilution treatment, each projected year's SBC ÷ market cap sets that year's dilution rate, capped at 30% a year. The rates compound to grow the share count over the horizon.
Filing currency
A company that reports in another currency than its shares trade in is modelled in its filing currency, as filed, and each per-share value is converted into the currency of the shares at the exchange rate saved with the model.
Override
A value typed into a projected cell of a driver row (Revenue growth, EBITDA margin, CapEx %, D&A %, NWC %, SBC % of Revenue). It replaces the slider for that year and is marked by a filled ●.